Water Quality Color Contour Plots are available for Reservoirs and can be accessed by right-clicking on a Reservoir in the map panel, then selecting the Plot WQ Color Contour option from the popup menu. The Water Quality Color Contour plot is displayed in four panels (Water Quality Color Contour Plot).

Water Quality Color Contour Plot
The first panel, located in the upper-left corner, is the Location Panel, which displays the following information (Water Quality Color Contour Plot - First Panel):
- Simulation: <Name of the selected simulation>
- Alternative: <Name of the selected alternative>
- Reservoir: <Name of the selected reservoir>
- HDF5 File: <HDF5 output file name and path?
- WQ Constituent:<wq constituent plotted>
- WQ Constituent Units: <units for the wq constituent>

Water Quality Color Contour Plot - First Panel
The Time Series Plot, located in the upper-right panel, by default displays the bottom elevation time series (Water Quality Color Contour Plot – Time Series Plot).

Water Quality Color Contour Plot – Time Series Plot
The Vertical Profile Plot, located in the lower-left panel, displays paired data for the selected time step, showing the relationship between elevation and the constituent (Elevation vs General constituent Plot).
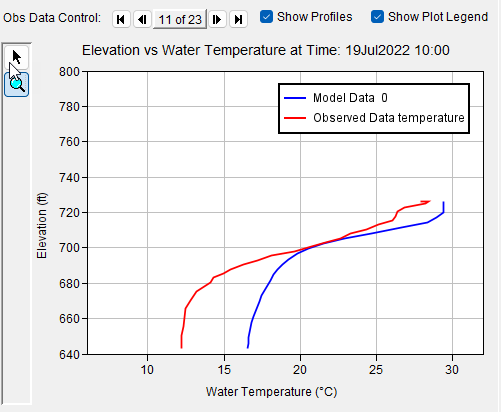
Elevation vs General constituent Plot
The Water Quality Color Contour Plot, located in the bottom-right panel, visualizes the color-contoured values of the selected constituent (Color Counter Constituent Plot).

Color Counter Constituent Plot
Users can modify the data displayed in the Time Series and Profile Plots by clicking and dragging the mouse within the Water Quality Profile Plots viewport area. To make these changes, first select the Pointer tool from the Water Quality Profile Plot Panel (Pointer Tool).

Pointer Tool
Once the Pointer tool is selected, the user can click anywhere on the Water Quality Profile Plot, and the other two plots will update to reflect the selected record. A red dot will appear at the clicked location on the plot viewport, indicating the selected point (Red Dot Plot).

Red Dot Plot