Water Quality Contour Plots are available for Reservoirs. They can be accessed by right-clicking on a Reservoir in the map panel and selecting the Plot WQ Color Contour menu option in the popup menu. The Water Quality Color Contour plot contains 4 panels (Figure 204).

Figure 14.8 – Water Quality Color Contour Plot
The first panel, located in the upper-left corner, is the Location Panel (Figure 205), which contains the following information:
- Reservoir: <Name of selected reservoir>
- HDF5 Output File: <HDF5 output file name and path?
- WQ Constituent:<wq constituent plotted>
- WQ Constituent Units: <units for the wq constituent>
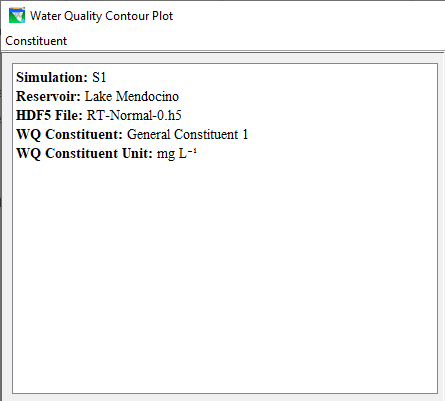
Figure 14.9 – Water Quality Color Contour Plot - First Panel
The Time Series Plot, located in the upper-right hand panel, displays by default the bottom elevation time series (Figure 206).
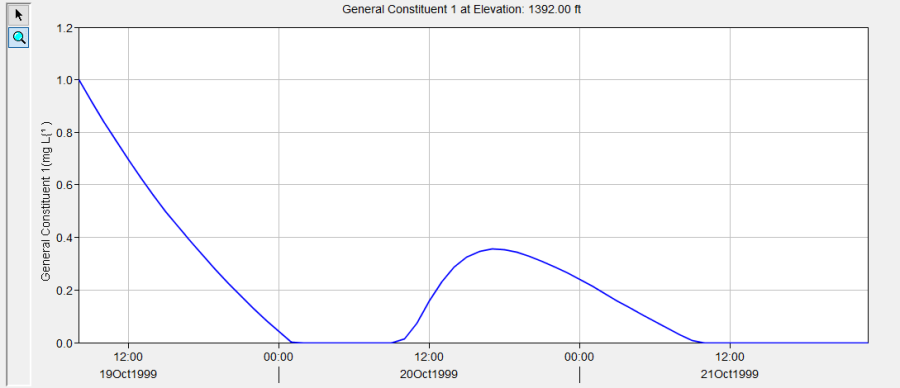
Figure 14.10 – Water Quality Color Contour Plot – Time Series Plot
The Vertical Profile Plot, contained in the lower-left hand panel, displays the paired data for the time step (Figure 207). By default, this time step is the first time step record in the dataset.
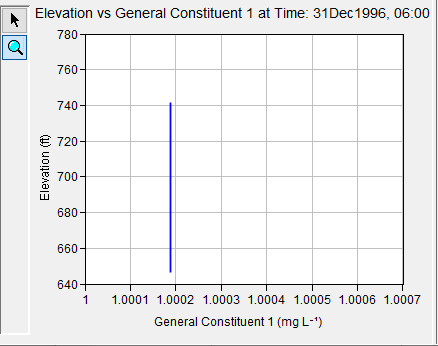
Figure 14.11 – Elevation vs General constituent Plot
The Water Quality Color Contour Plot, located in the bottom right panel, displays the color contoured constituent values (Figure 208).
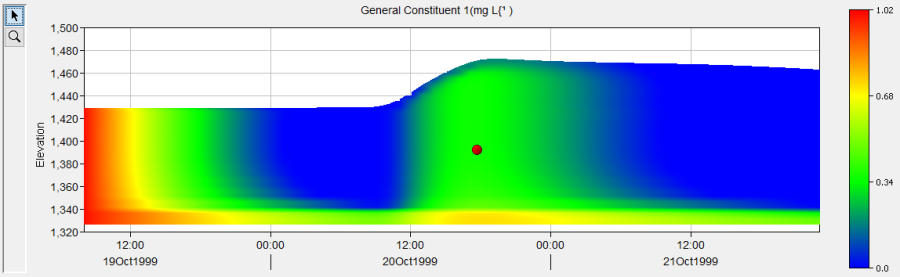
Figure 14.12 – Color Counter Constituent Plot
Users can change the Time Series and Profile Plots data by clicking and moving the mouse in the Water Quality Profile Plots viewport area. To change the Time Series and Profile Plots using the mouse pointer, first select the Pointer tool in the Water Quality Profile Plot Panel (Figure 209).

Figure 14.13 – Pointer Tool
Once the pointer tool is selected, the user can click anywhere on the Water Quality Profile Plot and the other two plots will update for the selected record. A red dot is added to the plot viewport at the clicked location (Figure 210).
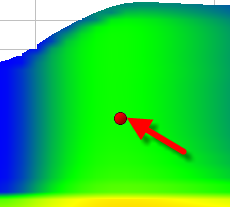
Figure 14.14 – Red Dot Plot