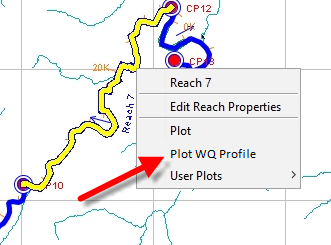
Water Quality Profile Plots are available for Reaches. Reach distance vs. water quality constituent value can be shown for each time step in the compute. To access the water quality profile plot, right-click on a reach in the map panel and select PlotWQ Profile from the popup menu (Figure 197).
Figure 14.1 – Plot WQ profile
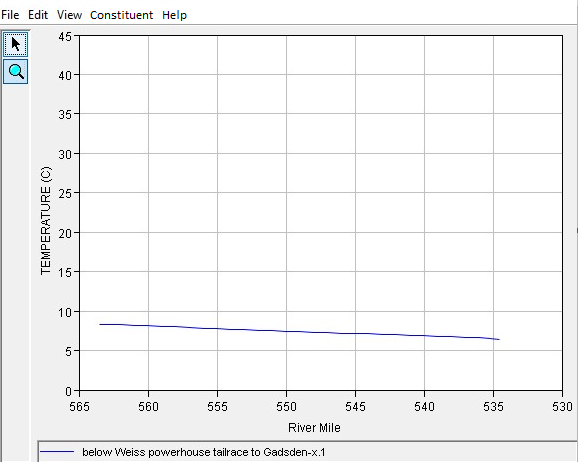
The WQ profile plot of the reach will show up (Figure 198).
Figure 14.2 – WQ profile
The Profile Plot contains additional plot menu options for controlling water quality data displayed in the plot. These menu options include the following:
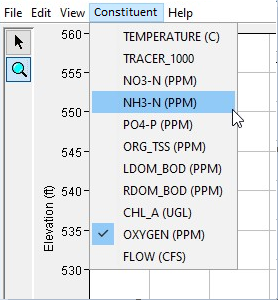
Constituent – Lists the constituents available for the plot (Figure 199). Selecting a constituent and adding a checkmark next to the name will add the constituent to the plot. Multiple constituents can be selected, but only two units (two Y axis) can be displayed at a time.
Figure 14.3 – Profile Plot - Constituents
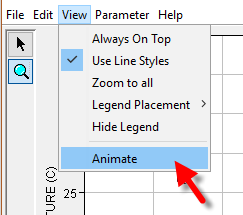
View-> Animate – Provides animation controls to animate the profile plot through the simulation time (Figure 200).