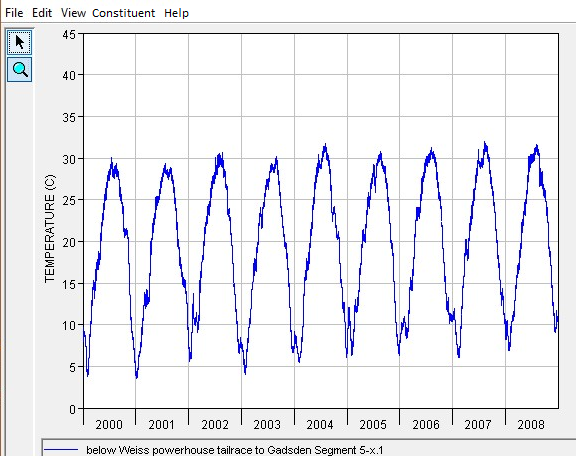
Time series plots display model results and observed data at particular locations (Figure 201). Simulated results may be viewed at any of the water quality cells by selecting the desired cell in the Reach, right-clicking, and selecting Plot WQ Time Series from the popup menu. This plot option is also available for Diversions and Junctions. Note: Junctions will plot the WQ Cell immediately downstream.
Figure 14.5 – Atmospheric Pressure Variable
Observed Data will also plot Water Quality Time Series Plots. Observed Data is accessed through the Observed Data Icons on the map panel. If Observed Data is associated with a Reach or Junction, the Observed Data will appear in its Time Series Plot. Also included in the plot are the selected constituent Reference Values.
Similar to the Water Quality Profile plot, the Water Quality Time Series plots allow the user to view multiple constituents by selecting them in the constituent menu.