Download PDF
Download page Entering Data into DSS with HEC-DSSVue.
Entering Data into DSS with HEC-DSSVue
Task 1. Regular interval time series data entry
You will be entering a portion of the observed hourly flow data for Fox Point, which is located on the Bear Valley River.
- Run HEC-DSSVue and create a new DSS file called “BearValley.dss”.
- A new DSS file can be created from the “File” menu in HEC-DSSVue.
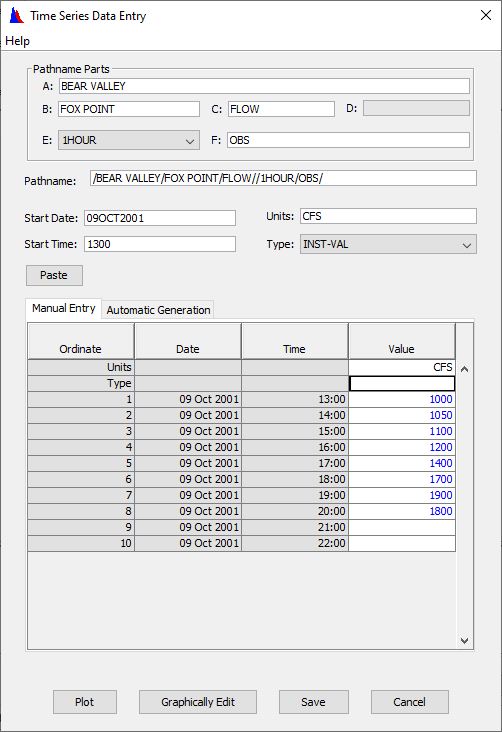
- From the “Data” menu, select “Manual Time Series” to enter the Manual Time Series Data Entry screen.
- The A and B parts are used to specify the location of the watershed and gage
- The C part specifies the parameter type
- The F part can be used to further describe the data.
- For this workshop use “OBS” for the F part to indicate observed data.
- You need to specify the Start Date and Start Time for the first value, and the Units and Data Type for the flow values.
- For this example:
- The flow data are in cubic feet per second (CFS)
- Hourly flow data is usually considered as instantaneous data (INST-VAL), much like reading temperature data from a thermometer.
- Reference the following table and enter the flow values for the dates and times shown:
- For this example:
Date / Time: | Flow (CFS) | |
09Oct2001 | 13:00 | 1000 |
09Oct2001 | 14:00 | 1050 |
09Oct2001 | 15:00 | 1100 |
09Oct2001 | 16:00 | 1200 |
09Oct2001 | 17:00 | 1400 |
09Oct2001 | 18:00 | 1700 |
09Oct2001 | 19:00 | 1900 |
09Oct2001 | 20:00 | 1800 |
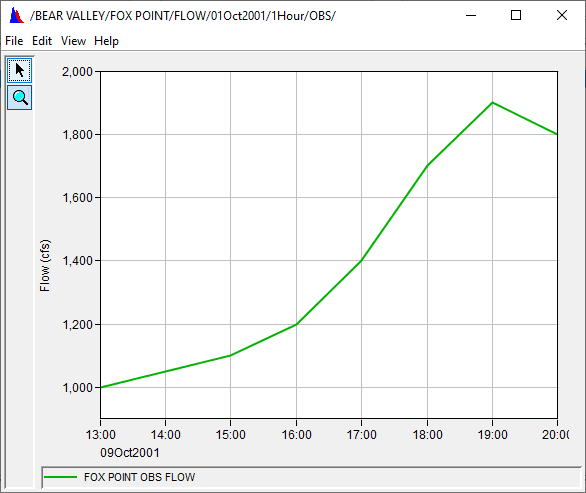
Fox Point Observed Flow (CFS)
5. After you have completed entering the eight flow values, plot the data to ensure that you did not mistype any values.
6. Save the data and close the data entry screen.
Task 2. Irregular interval time series data entry:
- Located within the same region is a random reporting precipitation gage.
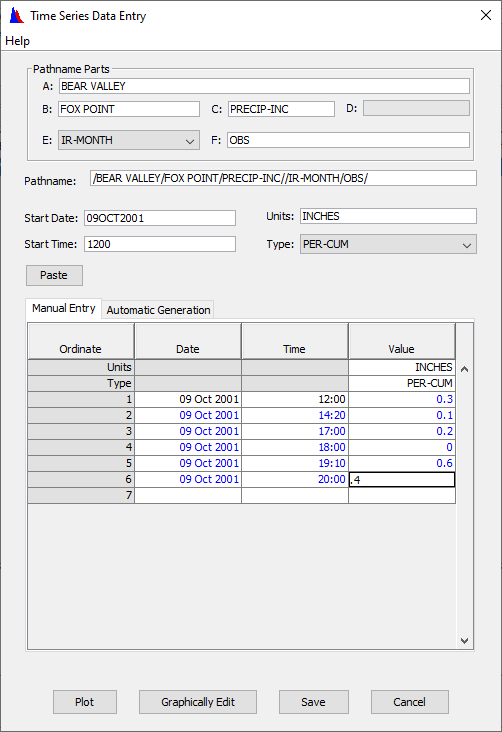
- Open a new Manual Time Series Data Entry screen and enter the values for this data set.
- Precipitation data for Fox Point is listed below.
- The pathnames should be similar for both sets of data with the exception of the parameter type (C part), which should be “PRECIP-INC”.
- Because the data is random-reporting, the data must be entered as irregular-interval.
- To accomplish this, select an “E part” of “IR-MONTH”.
- The precipitation data is measured in INCHES and the data type is period cumulative (PER-CUM), because that data represents rainfall accumulation over the period.
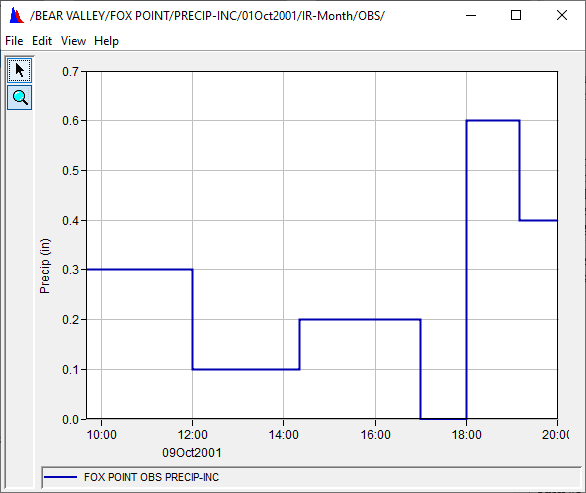
- Plot your data, save it and close the data entry screen.
Date / Time: | Precip (INCHES) | |
09Oct2001 | 12:00 | 0.3 |
09Oct2001 | 14:20 | 0.1 |
09Oct2001 | 17:00 | 0.2 |
09Oct2001 | 18:00 | 0.0 |
09Oct2001 | 19:10 | 0.6 |
09Oct2001 | 20:00 | 0.4 |
Fox Point Observed Precipitation (Inches)
Task 3. Automatic generation of regular interval time series data:
- Located below Fox Point is Junction Reservoir.
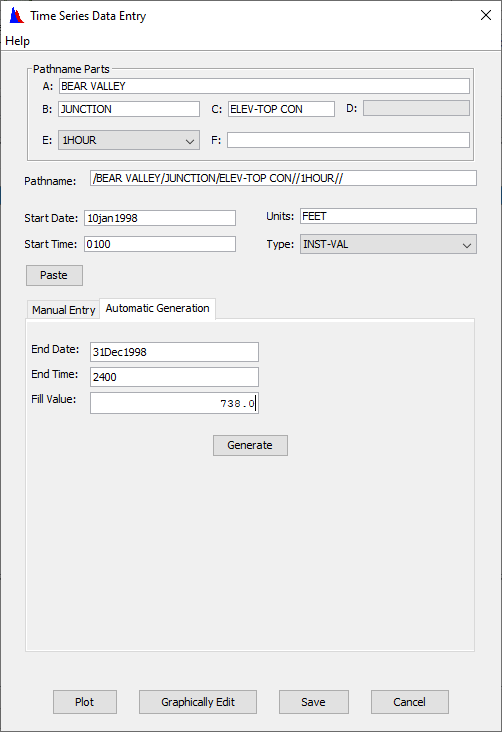
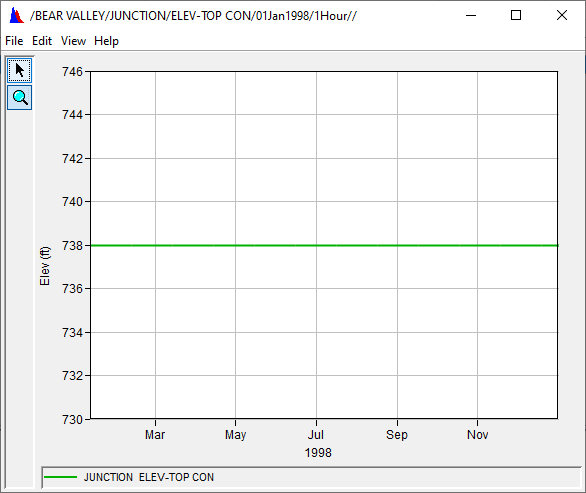
- A simulation program needs an hourly time series of the elevation of the top of the conservation pool for the year 1998, which is 738.00 feet for the entire year.
- Create this time series using the “Automatic Generation” tab
- With a C part of “ELEV-TOP CON” and no F part.
- Plot your data, save it and close the data entry screen.
Task 4. Pasting regular interval data
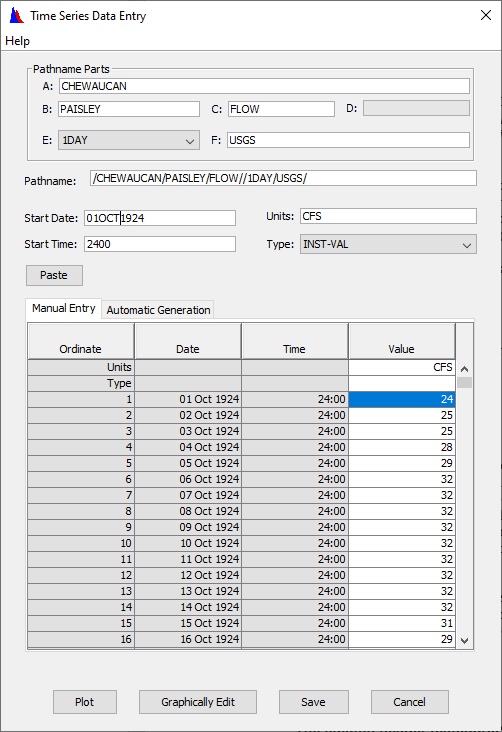
- Period of record average daily flows for Paisley on the Chewaucan River have been obtained from the USGS in an MS Excel spreadsheet called BearValley.xls.
- Enter this data into DSS from the Manual Time Series Data Entry screen using an F part of USGS.
- To accomplish this, open the spreadsheet and fill out the top portion of the data entry screen, including the start date and time (which is 01OCT1924 at 2400 hours).
- Now in MS Excel, select only the data values. (Excel Shortcut: Left-click to select the first cell containing flow data, then press CTRL+SHIFT+DownArrow to auto-select the entire data set).
- The last value is at row 24,488 and contains 24,471 values.
- Once the data has been selected, copy and paste the data into the HEC-DSSVue data entry table by selecting the first cell in the data column and then: pressing the “Paste” button.
- Plot your data, save it and close the data entry screen.
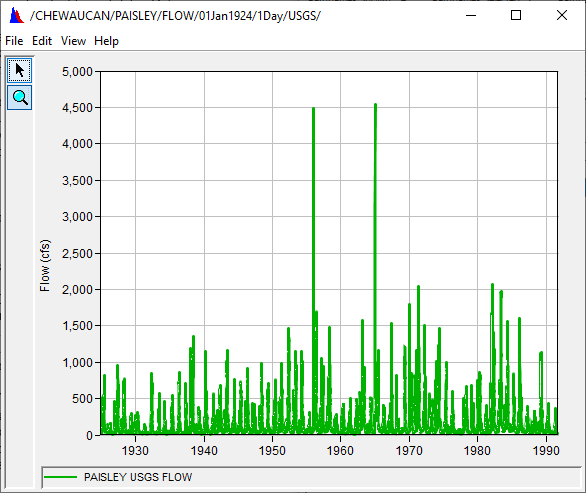
Question 1. What is the maximum value and when did it occur? What is the easiest way to determine this?
The maximum value is 4550 cfs on Dec 23, 1964 at 2400 hours. Although you could zoom in on the plot or tabulate that area, the easiest way to determine this is using the statistics tab in the math functions module.
Task 5. Pasting paired data
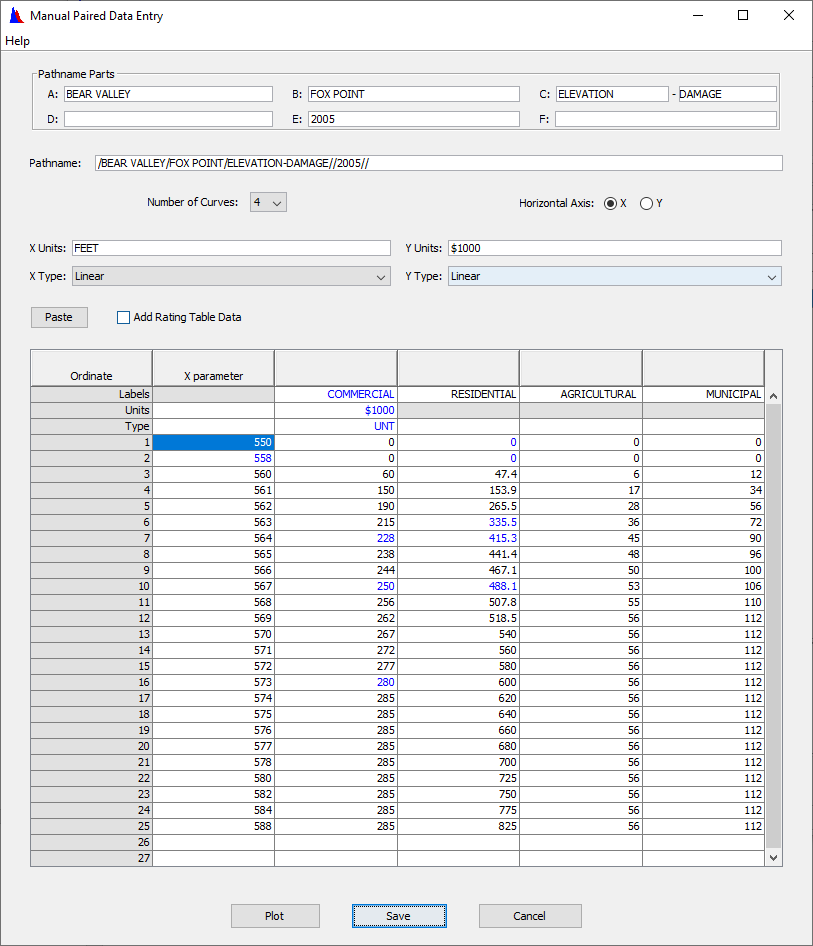
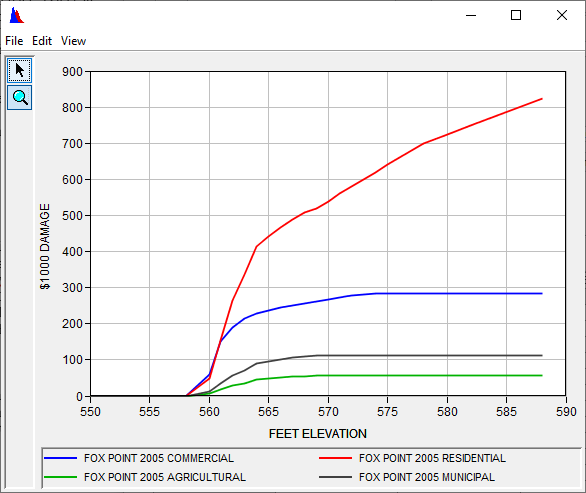
- The economics department has developed an elevation damage relationship for the current year for Fox Point, which is in the second sheet (Elevation Damage) of BearValley.xls.
- Open this sheet and review the data.
- Damages are reported in thousands of dollars ($1000)
Question 2. How many curves are represented by this data?
There are 4 curves here (don’t count the X ordinate column as a curve).
Question 3. What are the categories of each of these curves?
- Commercial
- Residential
- Agricultural
- Municipal
4. Open a manual paired data entry screen.
5. Fill out the top portion of the screen using your best estimate at pathname parts and label names.
6. Set the Number of Curves to four.
7. Now select the labels from Excel data set by clicking the mouse button on the first label cell (“COMMERCIAL”), moving the mouse to the right-most cell (“MUNICIPAL”), holding down the shift key and the pressing the left mouse button again. Select “Copy” from the edit menu. Now select the first editable label cell (that does not have a grey background) in the data entry screen, and then press the Paste button.
8. To copy the data from the Excel spreadsheet, follow a similar procedure. Select the first data cell and then move the mouse to the opposite corner of the data set and press the left mouse button again at the same time you are holding down the “Shift” key. Now select the first data cell (that does not have a grey background) in the data entry screen, and then press the Paste button.
Question 4. What did you use as the label names?
The column header (categories given above).
Question 5. Why couldn’t you enter a label for the X ordinate?
There can only be one X ordinate, which is given by the first part of the C part. There can be multiple Y ordinates, which must be of the second part of the C part. Each of these ordinates need a description or label.
Question 6. What would have happen if you selected the wrong number of curves to store?
The data would have been pasted in the wrong cells.
9. Plot your data, save it and close the data entry screen.
