Download page Graphical editing of time-series data with HEC-DSSVue.
Graphical editing of time-series data with HEC-DSSVue
Open the HEC-DSS file “Winnebago.dss”. This DSS file contains only one data set, the observed stage for Lake Winnebago in December 1999. The lake began to freeze during this month causing the stage gage to stick and a period of missing data. Select this data set and then from the HecDssVue Edit menu, choose Graphical Edit…
Task 1. Estimate missing data
There is approximately one day of missing data starting on December 30.
Zoom into this portion of data.
In the table, select with your mouse the value of 2.15 on December 30 at 0600 hours.
Scroll the table down to the value of 2.13 on December 31 at 1700 hours, and then press the left mouse button while holding down the shift key.
This will select all the rows between the two points.
Once the rows are selected, right mouse click and select Fill - Linear
This will cause values to be linear interpolated between the start and end points.
The interpolated values will show up as pink triangles in the graph.
If the values are drawn correctly, press the Accept button to use the new values.
What happens to the graph when you press the Accept button?
The values in the Estimate/Entry column of the table are copied into the Revised column. In the plot, the modified values are plotted in blue and the corresponding original values are plotted in red.
8. Zoom the graph back to its full size by selecting the zoom tool and clicking the right mouse.
Task 2. Point Editing
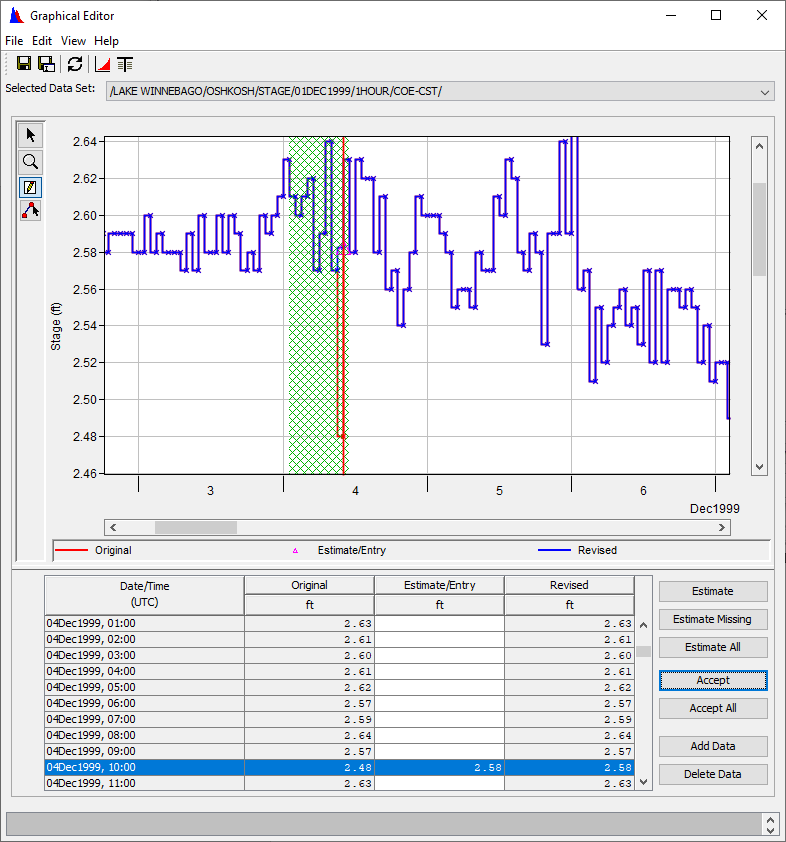
An abnormally low value is shown for December 4 at 1000 hours (2.48 feet).
Select the Single Point Edit tool and click on this value in the graph.
Verify that the highlighted row in the table is for December 4 at 1000.
Now double click the mouse at a value of about 2.5.
A pink triangle should appear.
Grab the triangle and move it to a value of about 2.58.
What happens when you move the triangle up or down?
The corresponding value in the "Estimate/Entry" column changes.
6. Press the Accept button to use the new value. If you zoomed in, zoom the graph back to its full size by selecting the zoom tool and clicking the right mouse button with the cursor in the graph.
Task #3 – Curve editing
The gage stuck on December 17 and it took several days before it was repaired.
Zoom in on the area to be edited (don’t zoom in too much).
Select the Multi Point Edit tool and draw in an “eyeballed” curve for the stuck values.
Left click on the left-most point to be edited and left clicking along your new curve points to the right until you reach the end of the segment that you are working on.
If you make a mistake, just move the mouse to the left of the bad value and left click again with the right value.
After you have finished, right mouse click to complete the segment and draw the new points.
If the values are drawn correctly, press the Accept button to use the new values.