Obtain period of record, daily data, for the Tuolumne River near Falls Creek, which flows into the North side of Hetch Hetchy, and store in Hetchy.dss
The USGS NWIS Station ID is 11276600
You should choose a "B part" of "Falls Creek".
If you do not have internet access, your instructor will tell you the name of the file to load.
Question 1:What steps did you take to get this data? What kind of data was imported? If you imported data from a file, use Notepad to look at it. Describe what it looks like.
Task 1. Go to Data Entry > Import > USGS Web. Change Part B to Falls Creek and make sure the Import Data checkbox and the Retrieve Period of Record checkbox is checked before selecting Import. Both Flow and water temperature data were imported.
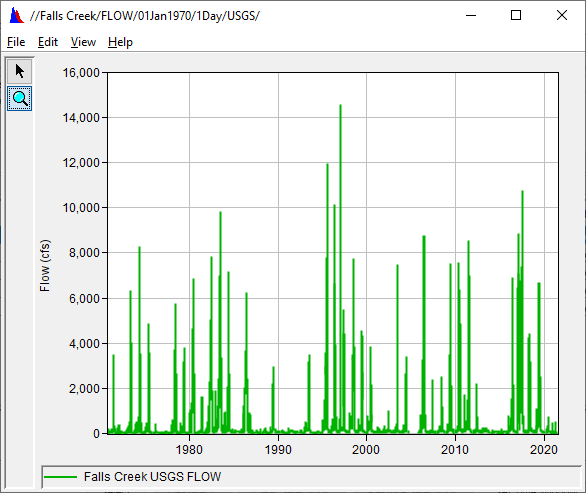
Question 2: Plot the flow data. What is the time span for this data?
The data is daily. It starts on 01Oct1970 and ends yesterday.
Question 3: What is the maximum value and when did it occur?
The maximum value is 14,500 cfs on 03Jan1997.
Question 4: What time of year are the flows the highest? The lowest?
The flows are usually highest between May and June with the exception of Dec1996-Jan1997. The flows are low between July and April.