Slide Canyon is in the top portion of the basin, at an elevation of 9200 feet. Snow depth is measured by sonic sensors pointing down towards the snow.

Daily measurements are given in file SliSnow.csv.

  1. Display the SliSnow.csv. file using Excel. 


a. Note that there is missing data on some rows.  The missing records in this file have 'm', instead of a data value.

b. Replace each 'm' value with a space.  Use Excel, as shown in the video below.  Close Excel when finished.

replace-m-with-space-using-excel.mp4


      2. Import the data from SliSnow.csv, into Hetchy.dss.

    1. From the Data Entry menu
    2. Select Import -> Excel Import (Beta).
    3. Navigate to SliSnow.csv and open it.
    4. Select the option: 'Time Series Data'.
    5. Click Next.
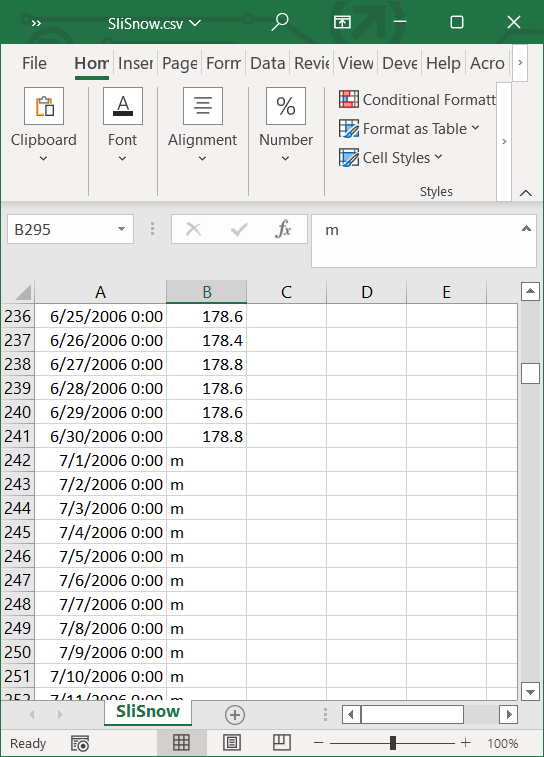
    6. Resize the width of Column A so you can see the dates.
    7. Select all the dates in column A - the date column.  Shortcut:  Select the first cell, then hold down the shift key and Ctrl key, then press the down arrow. 
    8. Click Next
    9. Select all the values (and blanks in column B)
    10. Click Next
    11. Use "SLIDE CANYON" for the B part
    12. Use "SNOW DEPTH" for the C part.
    13. The units are INCHES.
    14. Click Next to finish importing to DSSVue.

The video below demonstrates the steps above:


import-csv-time-series-file-into-dss.mp4

      3. Plot the data.


Question 1. What time span is this for?

The time span is November 2007 through July 2009.

Question 2. What do you think about the spikes?

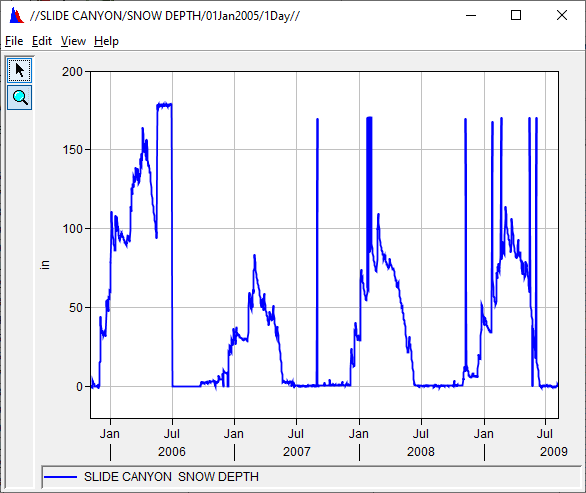
They are consistently at 178 and either stay there for along time, or just spike up. I'm guessing that this is what the sensor reports when it cannot find the snow or ground, or it is the malfunction value.

Question 3. What is the "real" maximum and when did it occur?

160 Inches on 06April2006.