1. Climate data for the Chalet area is in an Excel spreadsheet called CHALET.xls.
  2. Open CHALET.xls. with Excel and review it.   Note that the Hour is in a separate column from the Date.
  3. Use an Excel equation to create a combined Date-Time.
    1. Insert a new column C 'DateTime' as shown below. (Right Click Column C and select Insert)
    2. In Cell C2, Enter the Equation:  =A2+B2/24  
    3. Format Cell C2 to show both Date and Time
      1.  shortcut: Ctrl-1
      2. select custom format m/d/yyyy h:mm)
    4. Copy the equation for all other Cells in Column C.   (shortcut: double click the fill handle)
    5. Save the spreadsheet, then close Excel.


Import this data into Hetchy.dss using: Data Entry > Import > Excel Import (Beta).

    1. From the Data Entry menu,
    2. Select Import > Excel Import (Beta).
    3. Navigate to CHALET.xls and open it.
    4. Select the option: 'Time Series Data'.
    5. Click Next.
    6. Select all the dates in column C  'DateTime'
      1. Select cell C2
      2. Hold down the shift key and Ctrl key, then press the down arrow. 
    7. Click Next
    8. Select all values in Columns  $D$2:$Q$65536  (don't include the titles in Row 1). Shortcut:  Select Cell D2, hold down shift and Ctrl Keys together [don't let go], then press down arrow, then right arrow.   
    9. Click Next
    10. review the 'Final Review' screen
    11. Click Next.


The Video below demonstrates combining the Date and Hour, and importing into DSSVue:

import-excel-date-and-hour-in-separate-columns.mp4


Question 1. Why did the Excel Equation use the Hour divided by 24 (A2+B2/24) ?

Excel uses numbers to represent dates. The fractional part of the Number represent hours, so dividing by 24 converts a hour to a fractional part of a day. The image below demonstrates how excel interprets the number 1 and the number 1.5

Question 2. The data looked like hourly data.  I expected to see 1Hour in the E part of DSS.  Why is it IR-Year? 

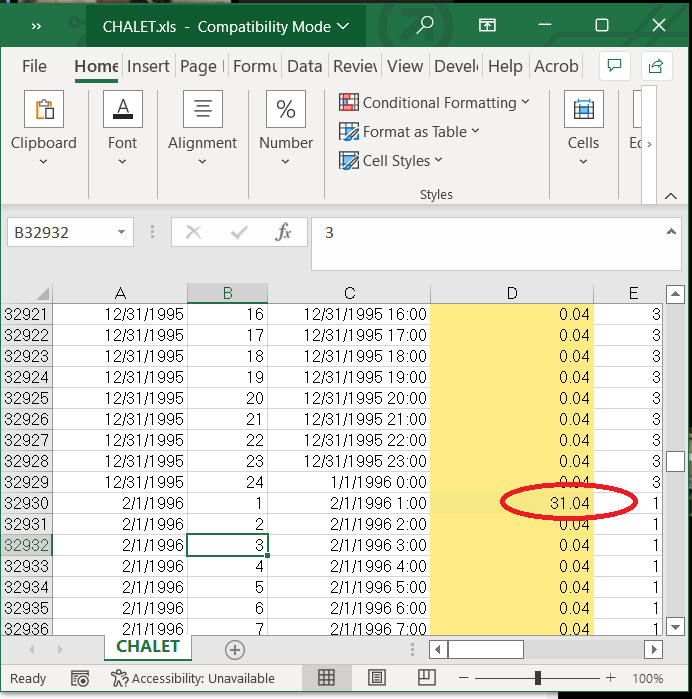
The import tool checks if all the time series data has a consistent interval.   In the CHALET.xls spreadsheet there is a missing month, January 1996, of data beginning on row 32,930.  There is also a missing year (1998) beginning on row 39,209.

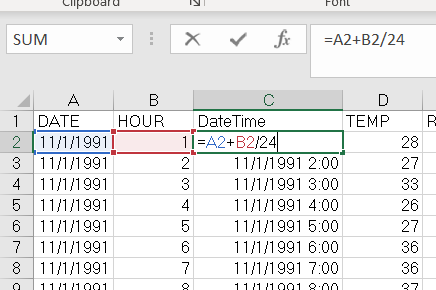
In the image below an equation was written in column D to measure the difference in Date/time between successive rows.  This technique can be used to check for missing data; if the difference is not consistent the data is considered Irregular. 


 Question 3.  What is the difference between CSV, XLS, XLSX

CSV - comma separated text file that can be opened with Excel, or a text editor.

XLS - binary Excel format ( our example file CHALET.xls is an older format that only supports 65,536 rows)

XLSX - latest Excel Format - XML-based - supports 1,048,576 rows!