If you have issues with the NOAA web page, or steps below, download this file: (HetchHetchy.csv) and skip to the step "Import the data into Hetchy.dss"
Open the link above and verify the name is Hetch Hetchy, CA.
Review on the map the location of Hetch Hetchy.
Click Add to Cart
In the upper right corner click Cart.
Select the second option: 'Custom GHCN-Daily CSV'
Select the Date Range 1910-10-01 to 2023-03-31 (if there is more recent data, include all available data)
Click Continue
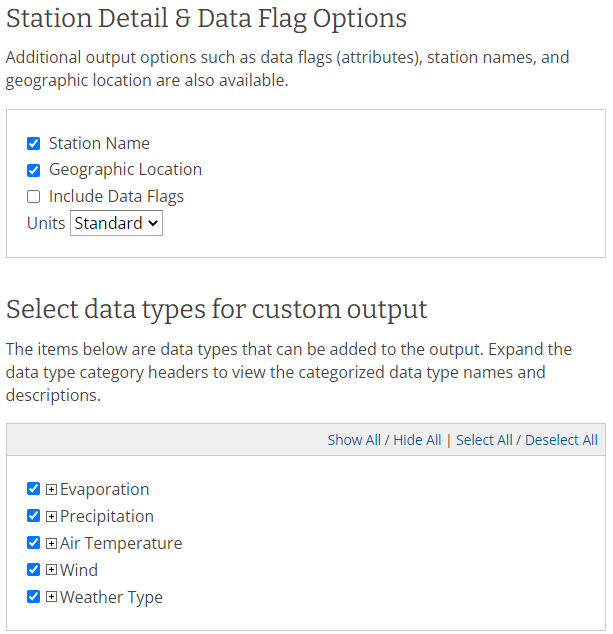
Select Geographic Location, and all data types as shown below
Click Continue
Click Submit Order, and wait a minute or two
Click Check Status
If the Status says 'Complete', Click Download and save to C:\Class\DSS\Exchanging Data with External Sources\HetchHetchy.csv
Import the data into Hetchy.dss.
In DSSVue Go to Data Entry > Import >Excel Import (beta)
Navigate to the file you downloaded HetchHetchy.csv
In the Excel Import Dialog
Select Time Series Data
Next
Select all the dates in Column F (shortcut: click Cell F2, then hold Shift-Ctrl-Down)
Next
Select the range G2:AE40395 (shortcut: select the range G2:AE2, then use the vertical scrollbar to scroll down to the bottom. While holding Shift Click in Cell AE:40395)
Next
Optional - Enter the units 'Fahrenheit' in Cells M6, N6, and O6
Next
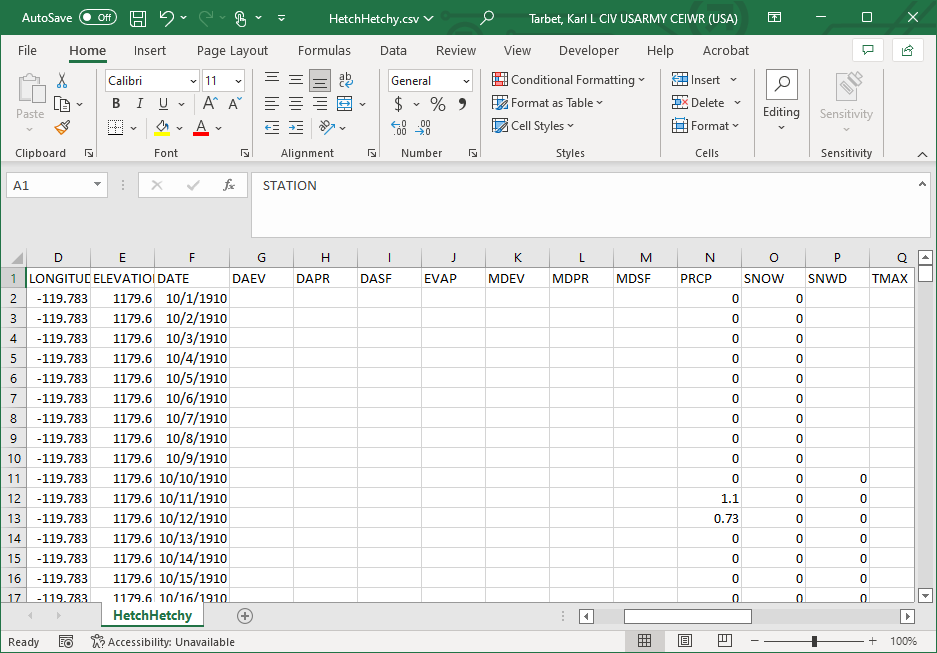
Question 1: What does the NCDC file look like?
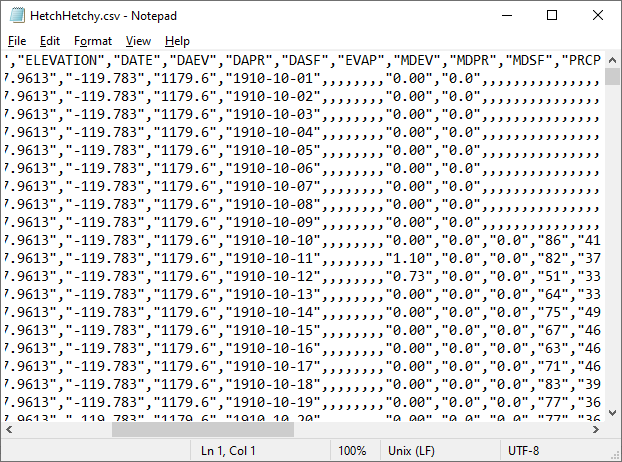
You can view CSV files in Excel, You could also look at the CSV file using notepad.
Question 2: What kinds of data were imported and what are the date spans of the data?
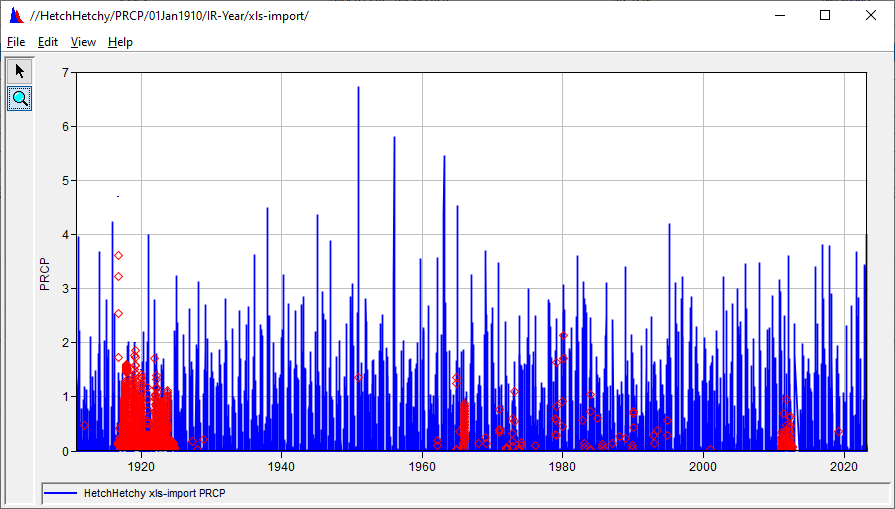
Data is daily climatological data. It includes Precip, Temp, and Snow. The date spans vary depending on the data type. Some data begins in 1910 and continues to the current year.
Question 3: Plot some of the data and describe what you see.