Customizing Axes
You can choose either a linear or log axis type, specify the axis scale, modify tic marks, and customize axis labels. Probability plots are generated for paired data sets with a type of "PROB", and cannot be changed without changing the data type.
Changing Axis Type
By default, plots display using a linear scale (Linear Axis), in which the axis increases and decreases by x. You can also use the log scale, which allows you to view curves that grow exponentially in a near straight line, because the axis increases or decreases by the log(x). For example, you might wish to use the log scale when the axis has evenly-spaced major tics with values of 1,10,100,1000, and so on, such as in a performance history plot showing many years of data.
To change the axis type of an individual plot, right-click on an axis, then from the Axis Tics shortcut menu, point to Set Axis Type, click Log Axis or click Linear Axis; depending on which axis type is already in use. In the figure below, the axis is using a Linear Axis, so the choice available is Log Axis. 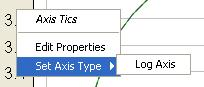
Specifying Axis Scale
You can specify the axis scale and tic interval for individual plots. To do this, select the editor either: 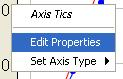
■ From the Edit menu, click Plot Properties. When the Plot Properties editor opens, click the Axis tab. From the Axis worksheet, select the axis you want to edit from the Axis list. Then select the Scale tab.
Or
■ Right-click on the axis using the Pointer Tool and from the Axis Tics shortcut menu (above), click Edit Properties. When the Axis Properties dialog box opens, click the Scale tab.
The Plot Properties editor with the Axis tab selected and the Scale worksheet open is shown below. The Axis worksheets of the Plot Properties editor and the Default Plot Properties editor are nearly identical, except for the Axis list on the Plot Properties editor. The Axis Label and Tics sub-worksheets are available in all three editors. 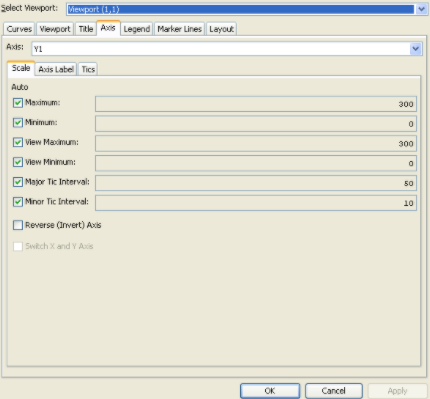
With the Scale worksheet, you can specify the range of the scale, the amount of the scale that is visible, and the tic intervals.
If the checkboxes under the Auto heading are checked, the plot will automatically select the scale. Otherwise, as you zoom in and out of the plot, its view values change while the minimum and maximum scale range values remain fixed:
■ Maximum: enter the value of the maximum range of the scale.
■ Minimum: enter the value of the minimum range of the scale.
■ View Maximum: enter the maximum visible range of the scale.
■ View Minimum: enter the minimum visible range of the scale.
Tic intervals are the distances between tics on the axis scale:
■ Major Tic Interval: specify the distance between each major tic.
■ Minor Tic Interval: specify a value less than or equal to the major tic value.
You can also choose to reverse the axis and invert the data by selecting Reverse (Invert) Axis. If the data set is paired, you can switch the X and Y axis, so what is plotted on the X axis becomes plotted on the Y axis instead.
Click Apply to save and view your changes without closing the editor. Click OK to save your changes and close the editor.
Modifying Tic Marks
You can modify the color of tic marks, choose whether or not major and minor tic marks display, and specify whether labels display. (See also "Specifying Axis Scale" above for information about modifying tic intervals.)
To modify tic marks in an individual plot, you can either:
■ From the Edit menu, click Plot Properties. When the Plot Properties editor opens, click the Axis tab. From the Axis worksheet, select the axis you want to edit from the Axis list. Once you have this set, click the Tics tab to set tic marks.
Or
■ Right-click on the axis using the Pointer Tool and from the Axis Tics shortcut menu, click Edit Properties. When the Axis Properties dialog box opens, click the Tics tab.
To specify default settings for axis tics in all of your plots, click Default Plot Properties from the plot Edit menu. Once the Default Plot Properties editor opens, choose the Axis tab, then the Tics tab.
The Tics worksheet of the Axis Properties editor is shown in Figure 6.38 above. The Tics worksheet is nearly identical on the Axis Properties editor, Plot Properties editor, and Default Plot Properties editor. 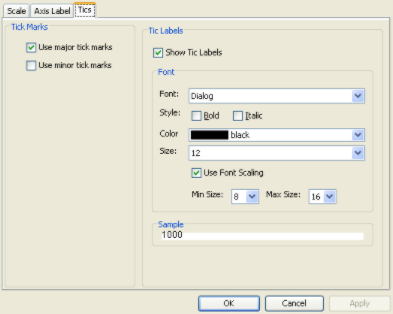
However, at the top of the Plot Properties editor is an Axis list containing all of the axes available for editing in the selected viewport. In the Plot Properties editor, you must choose an axis to edit before you can make any changes to the tics.
By default, plot axes display major tic marks with labels. To turn these defaults off, uncheck the Use major tick marks and Show Tic Labels check boxes by clicking on them.
You can also select Use minor tic marks, to display the minor tic marks in the viewport.
To change the Tic Label:
1. The tic and tic labels use the same color. To change their color, select a new color from the Color list in the Tic Labels group.
2. Select the label's typeset using the Font list. The font can display as Bold or Italic by checking the checkboxes next to either Style option.
3. By default the Size is ignored, and Use Font Scaling is selected. Use Font Scaling allows the program to determine the best font size to display, using the Min Size and Max Size to limit the range of the font size.
Click Apply to save and view changes without closing the editor. Once you are done making changes in the editor, click OK to save the changes and close the editor.
Customizing Axis Labels
You can add borders and backgrounds to axis labels. To customize axis labels in an individual plot, you can either: 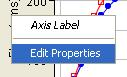 ■From the Edit menu, click Plot Properties. When the Plot Properties editor opens, select the axis label's viewport in the Select Viewport list at the top of the editor. Then click the Axis tab. On the Axis worksheet, select the axis you want to edit from the Axis list, and then click the Axis Label tab to set axis label properties.
Or
■ Right-click on the axis label with the Pointer Tool . From the Axis Label shortcut menu, click Edit Properties. The Label Properties editor will open.
To specify default settings for axis labels in all of your plots, select Default Plot Properties from the plot's Edit menu. Once the Default Plot Properties editor opens, choose the Axis tab, then the Axis Label tab.
The Label Properties editor is shown below. The same worksheet is available on the Axis Label tabs of the Plot Properties editor and Default Plot Properties editor, with a few differences. The Plot Properties editor has an Axis list containing all of the axes available for editing in the current selected viewport, which is displayed in the Select Viewport list.
The Axis Label worksheet has three groups: Font, Border and Background. The Sample box, located at the bottom left of the editor, provides a preview of the label changes.
The current label text is displayed in the Text box. To change the wording, highlight the displayed text in the box and type in the new axis label name. Text substitution can also be used here.
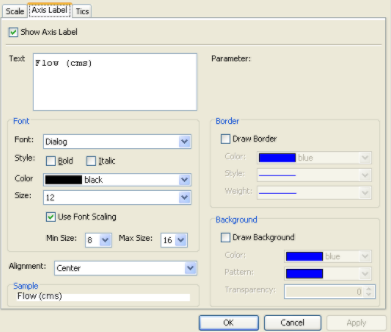
The font of the axis label can be customized using the tools located under the Font group. The text typeset can be changed using the Font list. The Style of the font can be changed by checking either the Bold or Italic checkboxes. Choose the color of your font in the Color list. By default the Use Font Scaling checkbox is set. This option allows the program to determine the best size of the font, limiting the range between the selected Min Size and Max Size. Otherwise, you can un-checking the Use Font Scaling and set a constant font size in the Size list.
The Alignment list allows you to position the label, Left, Right, or Center, relative to the axis.
To add a border around the axis label, check the Draw Border checkbox in the Border group, and then select the Color, Style, and Weight for the borderline.
To add a background to the axis label, check the Draw Background checkbox in the Background group, and then select a Color, Pattern, and the Transparency level.
Use the Show Axis Label checkbox to add or remove the axis label from the plot window.
Click Apply to save and view your changes without closing the editor. Click OK when you are finished editing axis label properties.