Customizing Legends
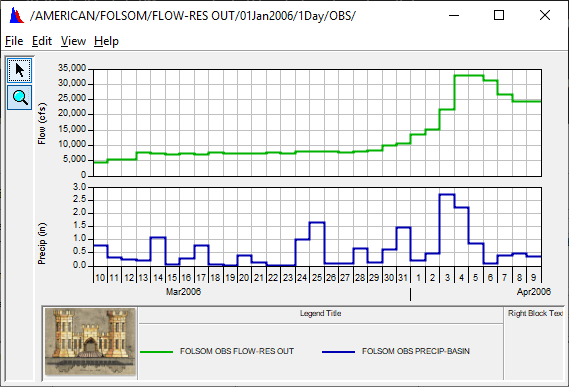
As illustrated in the figure below, you can add titles to a plot legend, add text and graphics to the right and left sides of the Legend box, and customize the curve labels in the Legend box. You can also specify whether the legend appears below, to the right, or inside the plot's viewports. The legend can even be displayed in a separate window or hidden from display.
To add a title or side blocks to an individual plot's legend, you can either:
■From the Edit menu, click Plot Properties. When the Plot Properties editor opens, select the Legend tab.
or
■ Right-click in a blank area inside the legend panel of the plot with the Pointer Tool . From the Legend Panel shortcut menu, click Edit Properties. The Legend Properties editor will open.
To specify default settings for all of your plot legends, from the Edit menu, click Default Plot Properties. Once the Default Plot Properties editor opens, select the Legend tab.
Whether you are using the Plot Properties editor, Legend Properties editor, or Default Plot Properties editor, the worksheet for editing legend titles is the same.
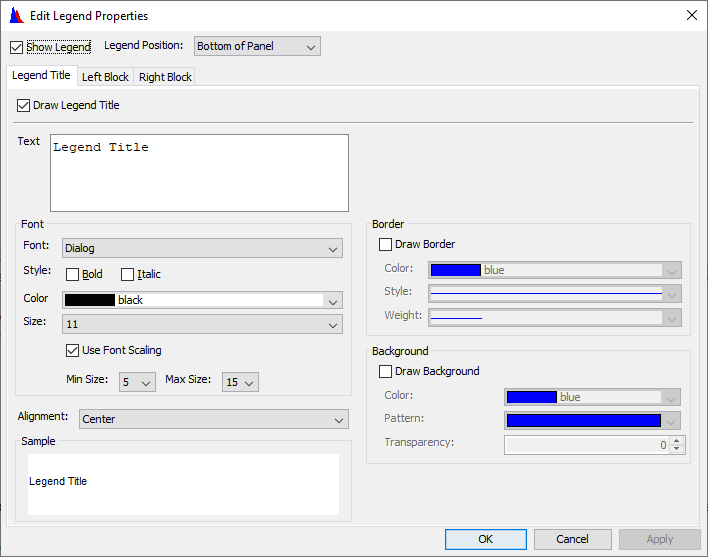
The Legend Properties editor is shown below. This worksheet, accessed from the shortcut menu, contains the same fields as the Legend worksheets of both the Plot Properties editor and the Default Plot Properties editor.
To remove the legend from the plot window, uncheck the Show Legend checkbox on the editor, or from the plot window's View menu select Hide Legend. If you would like to add the legend back to the plot window, either re-check the Show Legend box on the editor, or on the plot window from the View, click Show Legend.
Legend Title
To add and customize a title for the legend:
1. On the Legend Title tab, select the Draw Legend Title checkbox. Then enter the title you want to appear along the top of the legend in the Text box.
2. In the Font group, select the typeset for the title in the Font list. The Style of the font can also be changed by checking either the Bold or Italic checkboxes.
3. By default the Use Font Scaling checkbox is set. This option allows the program to determine the best size of the font, limiting the range between the selected Min Size and Max Size. Otherwise, you can un-checking the Use Font Scaling and set a constant font size in the Size list.
4.Select the Alignment to position the title to the Left, Right, or Center of the legend.
5. If you would like the title to use a custom border check the Draw Border checkbox in the Border group. Then select the Color, Style, and Weight for the borderline.
6. Similarly, if you would like the title to use a custom background check the Draw Background checkbox in the Background group. Then select the Color, Pattern, and Transparency for the title's background.
7. The Sample box in the lower left corner will display a preview of your title.
Legend Blocks
To add and customize a Left or Right Block to the legend:
1. First select the Left Block or Right Block tab in the Legend Properties editor and check the Draw Left Legend Block or the Draw Right Legend Block checkbox; depending on which workbook you are editing. The workbooks are identical, except for these Draw checkboxes.
2. Type in the text for the block in the Text box.
3. In the Font group, select the typeset for the block in the Font list. The Style of the font can also be changed by checking either the Bold or Italic checkboxes.
4. By default the Use Font Scaling checkbox is set. This option allows the program to determine the best size of the font, limiting the range between the selected Min Size and Max Size. Otherwise, you can un-checking the Use Font Scaling and set a constant font size in the Size list.
5. Select the Alignment to position the block's text to the Left, Right, or Center of the legend.
6. If you wish to display a graphic in the block, under the Icon group either type the exact path* and filename of the image in the File field, or use the ellipse button to use a file browser to find and select the image.
7. If you would like the block to use a custom border, check the Draw Border checkbox in the Border group. Then select the Color, Style, and Weight for the borderline.
8. Similarly, if you would like the block to use a custom background, check the Draw Background checkbox in the Background group. Then select the Color, Pattern, and Transparency for the title's background.
9. The Sample box in the lower left corner will display a preview of your legend block.
To move the legend to a new location, either select the location in the Legend Position list on the Legend tab of the editor or from the plot window, from the View menu, click Legend Placement. By default the legend is placed at the Bottom of Panel. Other options include: Right of Panel, Separate Window, Viewport Upper Left, and Viewport Upper Right. If the legend displays in the viewport, the title and legend blocks will not appear.
If the Legend Position is set for Right of Panel and the legend contains right and left blocks, the left block will be removed and the right block will display on the bottom of the legend.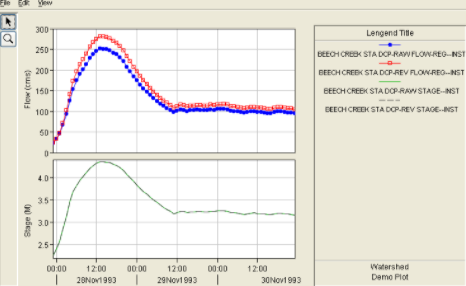
Click Apply to view your changes without closing the editor. When you are done making changes to the legend click OK to save your changes and close the editor.
Customizing Legend Items
By default, the curves display their DSS Pathnames inside the legend. However, the legend labels, named Legend Items, can be customized for individual curves.
To change a curve's Legend Item in an individual plot's legend, you can either:
■From the Edit menu, click Plot Properties. When the Plot Properties editor opens, select the Curves tab, then the Legend Item tab.

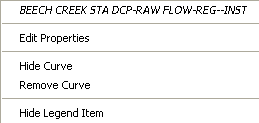
■ Right-click on a Legend Item (curve label) in the legend with the Pointer Tool . From the shortcut menu (below), select Edit Properties. The Curve Properties editor will open.
To specify default settings for all plot Legend Items, from the Edit menu, click Default Plot Properties. Once the Default Plot Properties editor opens, select the Curves tab, then the Legend Item tab. Whether you are using the Plot Properties editor, Legend Properties editor, or Default Plot Properties editor, the worksheet for editing Legend Items is the same.
To customize a Legend Item:
1. Enter the text you would like to display in the legend for the curve in the Text box. Text Substitution can also be used here.
2. In the Font group, select the typeset for the legend item in the Font list. A Style can be used for the font by checking the Bold and/or Italic checkboxes.
3. By default, the Use Font Scaling checkbox is set. This option allows the program to determine the best size of the font, limiting the range between the selected Min Size and Max Size. Otherwise, you can un-checking the Use Font Scaling and set a constant font size in the Size list.
4. If you would like the Legend Item to have a custom border around it, check the Draw Border checkbox in the Border group. Then select the Color, Style, and Weight for the borderline.
5. Similarly, if you would like the Legend Item to use a custom background check the Draw Background checkbox in the Background group. Then select the Color, Pattern, and Transparency for the item's background.
6. The Sample box in the lower left corner will display a preview of your Legend Item.
7. If you would like the font changes to apply to all of the Legend Items in the plot, click the All Legend Items use the same font checkbox at the bottom of the worksheet.
Click Apply to save your changes. Once you are done with the editor, click OK to save the changes and close the window.