Customizing Plot Layout
The Configure Plot editor (below) displays plot components in a "tree" structure and allows you to customize the layout of an individual plot. You can add and remove axes as well as add, remove, arrange the order of, and set the weight of viewports in the plot window panel.

When you customize the layout of a plot using the Configure Plot editor, your changes apply only to that individual plot unless you export the plot's properties.
To access the Configure Plot editor, from the Edit menu, select Configure Plot Layout.
Adding and Removing Viewports
To add a new viewport to a plot, from the Configure Plot editor's Edit menu click Add Viewport. The new viewport will appear at the bottom of the "tree" in the Selected Data Sets box.
To remove an empty viewport, you can either:
■ Click on the name of the viewport in the Selected Data Sets "tree". From the Edit menu, click Remove Viewport.
Or
■ Right-click on the viewport's name in the Selected Data Sets "tree". From the shortcut menu (below), click Remove.
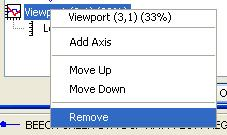
Shortcut menu
Setting Viewport Weights
You can customize the relative sizes of viewports in your plots. To do this:
1. From the Edit menu of the Configure Plot Layout editor, click Set Viewport Weights. The Set Plot Viewport Weights dialog box will open.
2.In the Set Plot Viewport Weights dialog box (below); you can specify the relative size of each viewport as a percentage value, with all of the weights adding up to 100%. Two viewports of equal weight at 50% each is shown below.
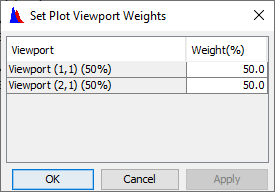
Click Apply to save and view your changes without closing the dialog box or click OK save your changes and close the dialog box.
Adding and Removing Axes
By default, viewports have a left Y-axis. You can add a right Y-axis, remove both the left and right Y-axes, and add a new left Y-axis if you have previously removed it. Viewports can have a maximum of two axes. You cannot remove an axis when a data set is associated with it.
To add an axis to a viewport, from the Configure Plot Editor you can either:
■ Click on the viewport's name in the tree in the Selected Data Sets box. From the Edit menu, click Add Axis.
Or
■Right-click on the viewports name in the tree in the Selected Data Sets. From the shortcut menu. click Add Axis.
The tree now displays another axis for the viewport you selected.
To remove an axis that has no data associated with it, you can either:
■ Click on the name of the axis you wish to remove in the tree in the Selected Data Sets box. From the Edit menu, click Remove Axis.
Or
■ Right-click on the axis you wish to remove in the tree in the Selected Data Sets box. From the shortcut menu click Remove.
Arranging Viewports and Axes
You can rearrange the vertical order of viewports in a plot window and move axes (with their associated data sets) to different viewports.
To move a viewport or axis:
1. From the tree in the Selected Data Sets box, right-click on the name of a viewport or axis you want to move.
2. From the shortcut menu, click Move Up or Move Down.
3. Either click OK or Apply for the change to take effect in the plot window.
Note that you cannot move individual data sets in the Configure Plot Layout editor. You can move only the axis with which a data set is associated.
Reversing Axes (Invert Data)
To reverse the direction of an axis so that the data is inverted, in the Configure Plot Layout editor, right-click on the name of the axis in the tree. From the shortcut menu, click Reverse. Either click OK or Apply for the change to appear in the plot window.