Customizing Viewport Properties
Viewports are the gridded areas in the plot window that contain plot curves. You can customize the border around the viewport, the background color and pattern, and the appearance of gridlines.
Customizing Viewport Borders and Background
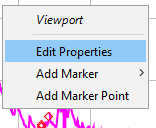
From the Edit menu, click Plot Properties. When the Plot Properties editor opens, click the Viewport tab or Right-click in a blank area inside the viewport with the Pointer Tool
, and then click Edit Properties from the shortcut menu.
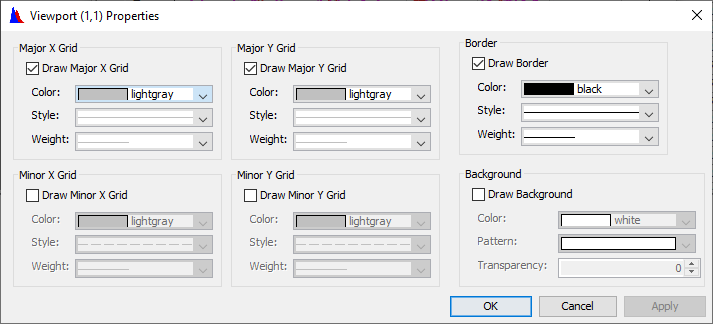
The Viewport Properties editor will open.
To specify the default border and background of viewports for all of your plots use the Default Plot Properties editor; from the Edit menu, click Default Plot Properties. Once the Default Plot Properties editor opens, select the Viewport tab. Changes made in the Default Plot Properties editor will apply to all viewports.
The Viewport (#,#) Properties editor, which displays the viewport number in the title bar is shown . This number reflects the position of the viewport on the Plot dialog box. For example: if you had two viewports in you plot, the top viewport's number will display as (1,1). The bottom plot would display as (2,1). The worksheet, accessed from the shortcut menu, contains the same items as the Viewport tab of the Plot Properties editor and the Viewport tab of the Default Plot Properties editor. In the Plot Properties editor there is a Select Viewport list when multiple viewports are displayed in the plot. Select the viewport you would like to edit using this list.
The Viewport tab has six main groups: Major X Grid, Major Y Grid, Minor X Grid, Minor Y Grid, Border and Background.
To customize the Border and Background of a Viewport:
1. Check the Draw Border checkbox at the top of the Border group and choose the Color, Style, and Weight for the border line you want to appear around the selected viewport.
2. Select Draw Background in the Background group and choose the Color, Pattern, and Transparency you want for the background.
Click Apply to save your changes and continue adjusting the appearance of the border and background. Click OK when you are finished.
Customizing Viewport Gridlines
To customize gridlines of viewports in an individual plot, from the Edit menu, click Plot Properties. When the Plot Properties editor opens, click the Viewport tab. Or Right-click in a blank area inside the viewport with the Pointer Tool , and then click Edit Properties from the shortcut menu.
To specify viewport gridlines for all of your plots, from the Edit menu, select Default Plot Properties. Once the Default Plot Properties editor opens, choose the Viewport tab.
By default, the plot viewport displays gridlines only for the Major X Grid and Major Y Grid. The default color is light gray. To change the appearance of Major X and Y gridlines, select the Color, Style, and Weight of the gridlines located under their respective groups.
By default, the Minor X Grid and Minor Y Grid are not selected to draw and do not display in the plot viewport. If you want to display gridlines for the Minor X Grid and Minor Y Grid, check the Draw Minor X Grid and Draw Minor Y Grid checkboxes and then make your selections for Color, Style, and Weight (below). 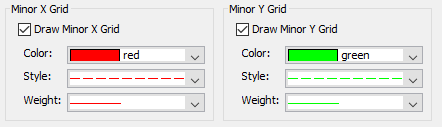
Click Apply to view your changes without closing the editor. Click OK when you are finished.