Plot Editors and Tools
The following sections are an overview of the editing tools that allow you to customize plots. Later sections provide more detailed instructions on editing specific plot properties using these tools.
Plot Properties Editor
The Plot Properties editor is accessed from the Edit menu of a Plot dialog box by clicking Plot Properties. It allows you to configure multiple display properties for the individual plot, including the Curves, Viewport, Title, Axis, Legend, Marker Lines, and the Layout or properties of the plot window panel. When you customize properties of a plot using the Plot Properties editor, your changes apply only to the individual plot displayed; unless you export the plot's properties in a template.
Individual Plot Property Editors
When you want to edit a specific property of a plot without launching the Plot Properties editor, you can use individual plot property editors instead. These individual plot property editors correspond to the tabs of the Plot Properties editor. 
To access an individual plot property editor, right-click on the component, in in the plot, that you want to edit and then select Edit Properties from the shortcut menu. For example, if you right-click inside the gridded plot area, called the viewport, you will see the Viewport shortcut menu:

When you choose Edit Properties, the Viewport Properties editor will open:
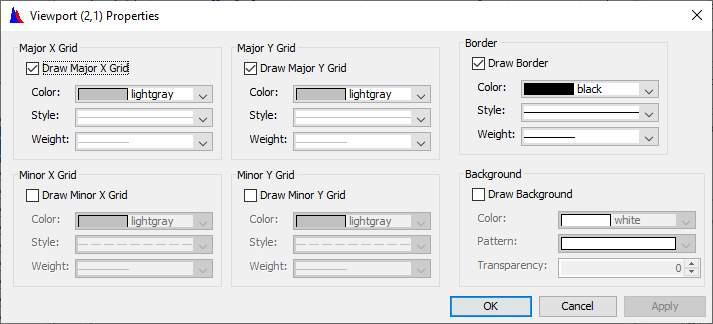
The Viewport Properties editor lets you edit only properties associated with that particular viewport, using the same options that appear for viewports in the Plot Properties editor.
Other individual properties editors are the Edit Title Properties, Axis Properties, Curve Properties, Label Properties, Marker Properties, and Legend Properties.
The only plot property you cannot edit using an individual property editor is the Layout.
Configure Plot Editor
The Configure Plot editor is accessed from the Edit menu of a plot and allows you to customize the data configuration of an individual plot. You can add and remove axes and add, remove, arrange the order of, and set the weight of viewports in the plot window.
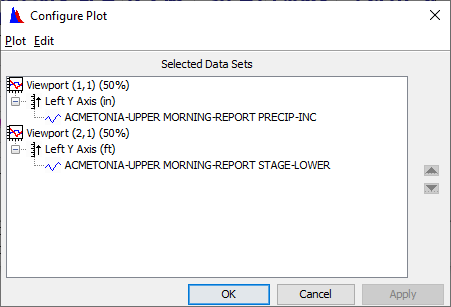
When you customize the layout of a plot using the Configure Plot editor, your changes apply only to that individual plot; unless you create a template from the plot's properties.
To access the Configure Plot editor, from the Edit menu, click Configure Plot Layout.
Default Line Styles Options Editor
With the Default Line Styles options editor, you can specify the default line and fill styles, as well as labels, used across all plots for specific parameters. 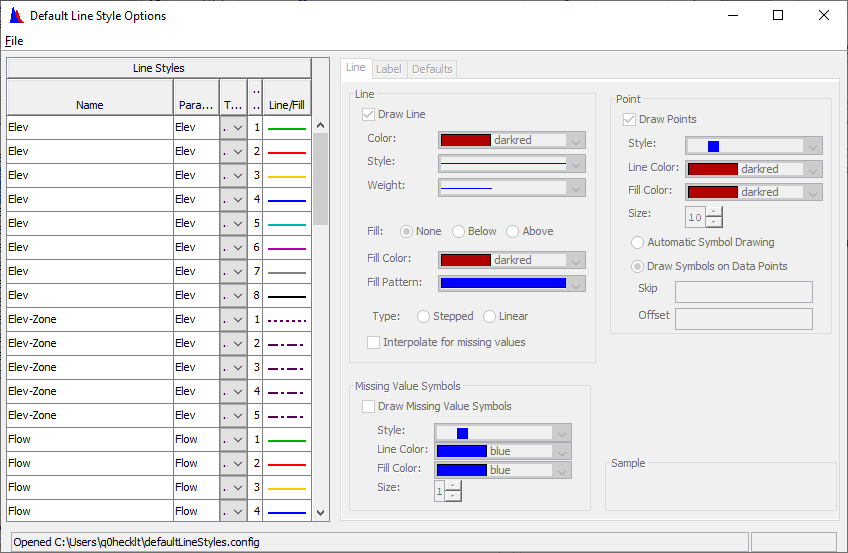
To access the Default Line Styles options editor, from the Edit menu, choose Default Line Styles.
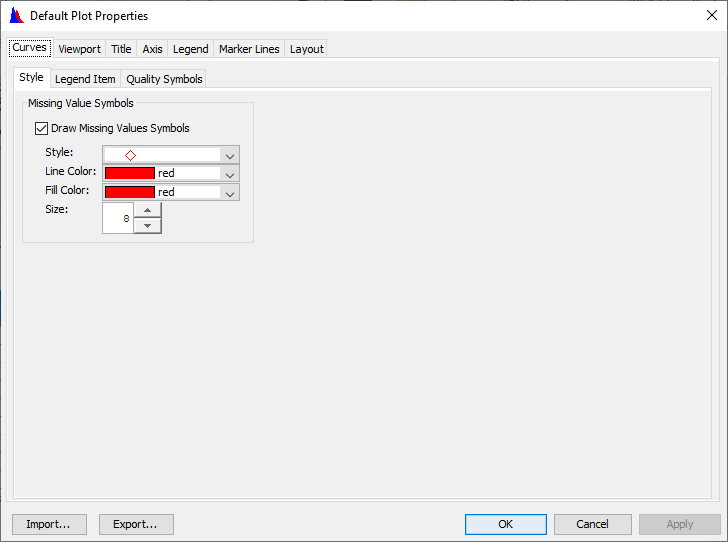
Default Plot Properties Editor
The Default Plot Properties editor allows you to configure the default display properties of all plots you create. Properties you can configure include Curves, Viewport, Title, Axis, Legend, Marker Lines, and Layout, which include the miscellaneous properties of the plot window panel.
When you customize plot properties using the Default Plot Properties editor, your changes will apply to all future plots you create. If you would like to apply them to the plot you currently have open, you will need to close and then reopen it first.
To access the Default Plot Properties editor, from the Edit menu, click Default Plot Properties.