Most functions modify the values in the selected data. However, the Math Functions screen retains a copy of the original data, which you may use for comparison plotting with the computed result or for "undoing" the compute action. Other functions, such as "Merge Time Series", may generate a new data set, which is appended to the data set list in the Selected Data Set list.
Once a data set has been modified or generated by a function compute, you can save the data to the file, plot it, or tabulate it using the menu options or menu bar buttons located at the top of the Math Functions screen. A computed data set is not automatically saved to the file until you explicitly save the operation.
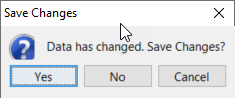
When you exit the Math Functions screen, if one or more data sets have been modified but not saved, you will be prompted with the Save Changes message shown below. Save the changes by clicking Yes.
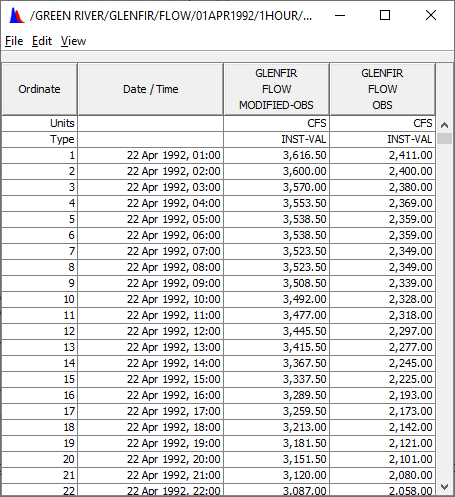
In plots and tables below, the F-Part of the pathname includes "MODIFIED-". This is not retained when the data set is saved to the file and saving the resulting data will overwrite records in the file. In the image below, the "GLENFIR" time series multiplied by 1.5 in the math functions. The resulting data set is "GLENFIR MODIFIED".

Selecting Paired Data Curves for Function Operations
Typically paired data has a set of x-values and a corresponding set of y-values (e.g. a stage-flow rating table). For example, with the Add function, a constant may be added to STAGE, FLOW, or both as shown below.
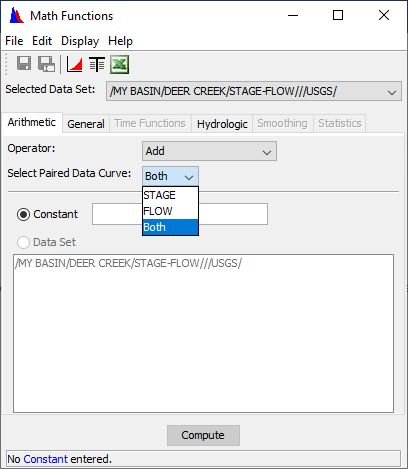
A paired data set may have multiple sets of y-values, or curves, which share the same x-ordinates (e.g. frequency-damage curves for multiple categories). Math functions that operate on paired data sets allow the user to select one or all of the paired data curves for the function application.
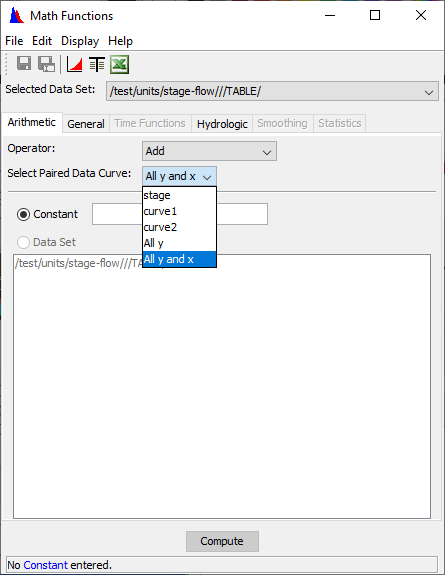
The paired data curve to apply the add function is picked using the Select Paired Data Curve list. The list is filled with the paired data curve labels. In the example above case, there are two curves (curve1, curve2). The "All" selection in the list refers to the option to pick all curves for the function operation. If the paired data curves are not explicitly labeled in the paired data set, the curve list is then filled with the curve numbers. The Select Paired Data Curve list only appears if the selected data set is paired data.