Time Functions
The Time Functions tab (below) contains the following functions: Min/Max/Avg… Over Period, Copy in Time, Shift in Time, Change Time Interval, Irregular to Regular, Regular to Irregular, To Irregular using Pattern, and Extract Time Series.

Min/Max/Avg/… Over Period
The Min/Max/Avg/… Over Period function generates a time series data set using a variety of functions from an existing irregular or regular interval time series data set.

The functions are:
Interpolate at end of Period
Maximum for Period
Minimum for Period
Average over Period
Accumulation over Period
Volume for Period
Integration over Period
Number of Valid Data over Period
where "period" is a user selected time interval to evaluate the data over. This function is often used to compute information such as the maximum or minimum annual flow, total annual precipitation, and maximum and minimum daily temperatures. (See remarks following regarding computing values for water years.)
The resulting data can be put in an irregular-interval data set. By doing so, the date and time of each occurrence will be saved with the data. For example, if maximum annual flows are computed, the date and time of that maximum will be provided with an irregular-interval block. You should choose an irregular-interval block size, so that between 50 and 1,000 values are stored in a block. Daily data results should use a block size of "IR-YEAR". Annual results should use a block size of "IR-DECADE".
Besides choosing a standard interval, you can also select a Custom Period Interval. This provides you the capability to compute information over a period that is different from a standard storage interval, such as two-day averages, and maximum or accumulation over 2, 5 or 10 years. To compute using a custom interval, select Custom Period Interval and then enter an integer interval value and select the time increment for that value from the list further to the right. The time increments include: Minute, Hour, Day, Week, Month, and Year. If you choose a custom period interval, the results must be stored in irregular-interval data sets.
The data type of the original time series data governs how values are interpolated. Data type "INST-VAL" (or "INST-CUM") considers the value to change linearly over the interval from the previous data value to the current data value. Data type "PER-AVER" considers the value to be constant at the current data value over the interval. Data type "PER-CUM" considers the value to increase from 0.0 (at the start of the interval)
up to the current value over the interval. Interpolation of the three data types is illustrated below.

How interpolation is performed for a specific data type influences the computation of new time series values for the selected function. For example, if the data type is "INST-VAL", the function Maximum for Period is evaluated by:
■Finding the maximum value of the data points from the original time series that are inclusive in the new time period.
■Linearly interpolate values at beginning and ending of the new time interval, and determine if these values represent the maximum over the interval.
Referring to the plots above, the Average over Period function is applied to a time series by integrating the area under the curve between interpolated points and dividing the result by the interval time.
Times in the new time series may be shifted (offset) from the regular interval time by a user specified offset. As an example, the offset could be used to shift times in regular hourly interval data from the top of the hour to 6 minutes past the hour.
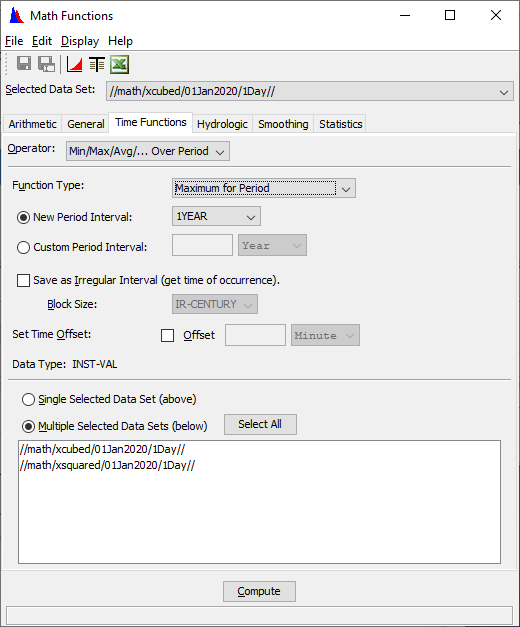
The figure below shows the appearance of the Math Functions screen for the Min/Max/Avg/… Over Period function when multiple series are selected before opening the Math Functions dialog.
To compute the minimum, maximum, average, etc. of time series data sets:
1.Choose the Time Functions tab of the Math Functions screen and select the Min/Max/Avg/… Over Period operator.
2. Select a data set to apply the function from the Selected Data Set pull-down list at the top of the screen or multiple data sets from the list in the lower portion of the screen. If you include the data set selected in the top Selected Data Set, the operation on that set will only be done once.
3. From the Function Type list, select the computation to apply to the data.
4. From the New Period Interval list or the Custom Period Interval list, select the interval period to compute values for.
5. If you select a Custom period, enter the integer period interval and select the minute/hour/day/week/month/year time increment for that value from the list further to the right.
6. Optionally, you may put the data in an irregular interval time series data set, which will retain the dates and times of each occurrence. You should choose an irregular-interval Block Size, so that between 50 and 1,000 values are stored in a block. Daily data results should use a block size of "IR-YEAR". Annual results should use a block size of "IR-DECADE".
7.Optionally, you may specify a Time Offset to offset the new points in time from the standard interval time. For example, if you select a daily interval for the Time Interval, you may use the option to offset time points to be at 6 a.m. instead of at midnight. If the Set Time Offset box is checked, enter an integer number in the box to the right and select the minute/hour/day/week/month/year
time increment from the list further to the right. If the Set Time Offset box is unchecked, times in the resultant data sets will fall on the regular interval time (typical setting).
8. Click Compute.
Copy in Time
The Copy in Time function copies the data set and sets a new start time with a specified increment from the original or to start at a specified date and time. Both the original and the copied data values are not changed, except where the two data sets overlap. The difference between the Copy in Time function and the Shift in Time function is that the shift function deletes the original data before storing the shifted data, whereas the copy function does not. Data sets may be regular or irregular interval time series data.
To copy time series data sets to another time:
1.Choose the Time Functions tab of the Math Functions screen and select the Copy in Time operator, as shown below.

2. Select a data set to apply the function from the Selected Data Set pull-down list at the top of the screen or multiple data sets from the list in the lower portion of the screen. If you include the data set selected in the top Selected Data Set, the operation on that set will only be done once.
3. In the Copy by Amount box, enter the amount of the time to increment the data sets by (integer values only) and then select Minute, Hour, Day, Week, Month or Year. To increment data backwards in time, use a negative amount for the time shift.
4. Alternatively, you may select the Copy to Date/Time radio button and specify the date and time to copy the first value in each data set to.
Shift in Time
The Shift in Time function shifts the times in time series data sets by a specified increment or to start at a specified date and time. The original data values are removed from the file when the shifted data is stored. To accomplish this, the data sets must be saved immediately following the operation. For example, if you shift data by one year from 1965 to 1966, data will exist for 1966 and not 1965. To retain the original data, use the Copy in Time function. Data sets may be regular or irregular interval time series data.
To shift times in time series data sets:
1.Choose the Time Functions tab of the Math Functions screen and select the Shift in Time operator, as shown below.

2. Select a data set to apply the function from the Selected Data Set pull-down list at the top of the screen or multiple data sets from the list in the lower portion of the screen. If you include the data set selected in the top Selected Data Set, the operation on that set will only be done once.
3. In the Shift by Amount box, enter the amount of the time to shift the data sets by (integer values only) and then select Minute, Hour, Day, Week, Month or Year. To shift data backwards in time, use a negative amount for the time shift.
4. Alternatively, you may select the Shift to Date/Time radio button and specify the date and time to shift the first value in each data set to.
Change Time Interval
The Change Time Interval function interpolates or extracts values from existing regular interval time series data sets to new regular interval time series data sets with a different time interval.
Whether the time series data type is "INST-VAL", "INST-CUM", "PER-AVER", or "PER-CUM" controls how interpolation is performed. Interpolated values are derived from "INST-VAL" or "INST-CUM" data using linear interpolation. Values are derived from "PER-AVER" data by computing the period average value over the new time interval. Values are derived from "PER-CUM" data by computing the period cumulative value over the new time interval.
For example, if an original data set is hourly data and the new regular interval data set is to have a six-hour time interval:
■The value for "INST-VAL" or "INST-CUM" type data is computed from the linear interpolation of hourly points bracketing the new six-hour time point.
■The value for "PER-AVER" type data is computed from the period average value over the six-hour interval.
■The value for "PER-CUM" type data is computed from the accumulated value over the six-hour interval.
The treatment of missing value data is also dependent upon data type. Interpolated "INST-VAL" or "INST-CUM" points must be bracketed or coincident with valid (not missing) values in the original time series; otherwise the interpolated values are set as missing. Interpolated ""PER-AVER" or "PER-CUM" data must contain all valid values over the interpolation interval; otherwise the interpolated value is set as missing.
To change the time interval in time series data sets:
1. Choose the Time Functions tab of the Math Functions screen and select the Change Time Interval operator, as shown below.

2. Select a data set to apply the function from the Selected Data Set pull-down list at the top of the screen or multiple data sets from the list in the lower portion of the screen. If you include the data set selected in the top Selected Data Set, the operation on that set will only be done once.
3. From the Time Interval list, select the new time interval for the data sets.
4. Optionally, you may specify a Time Offset to offset the new points in time from the standard interval time. For example, if you select a daily interval for the Time Interval, you may use the option to offset time points to be at 6 a.m. instead of at midnight. If the Set Time Offset box is checked, enter an integer number in the box to the right and select the minute/hour/day/week/month/year time increment from the list further to the right. If the Set Time Offset box is unchecked, times in the resultant data sets will fall on the regular interval time (typical setting).
5. Click the Compute button to perform the interpolation.
Irregular to Regular
The Irregular to Regular function interpolates or extracts values from existing irregular interval time series data sets to create new regular interval time series data sets, or "snaps" (moves) irregular interval data to the regular times.
For interpolating, whether the time series data type is "INST-VAL", "INST-CUM", "PER-AVER", or "PER-CUM" controls how the interpolation is performed. Interpolated values are derived from "INST-VAL" or "INST-CUM" data using linear interpolation. Values are derived from "PER-AVER" data by computing the period average value over the new regular time interval. Values are derived from "PER-CUM" data by computing the period cumulative value over the new regular time interval.
For example, if the original data set has data that typically occurs several times in a six-hour period and the new regular interval data set is to have a six-hour time interval:
■The value for "INST-VAL" or "INST-CUM" type data is computed from the linear interpolation of points bracketing the new six-hour time point.
■The value for "PER-AVER" type data is computed from the period average value over the six-hour interval.
■The value for "PER-CUM" type data is computed from the accumulated value over the six-hour interval.
The Snap function derives new regular interval time series by "snapping" data to a user specified regular interval time if the time of the original data falls within the time window tolerance set by the user. A snap just changes the time of the data values and does no interpolation. For example, a time series record from a gauge recorder collects readings six minutes past the hour. The Snap Irregular to Regular function is often used to "snap" or shift the time points to the top of the hour.
Times in resultant time series may be shifted (offset) from the regular interval time by a user specified offset. As an example, the offset could be used to shift times in regular hourly interval data from the top of the hour to 6 minutes past the hour.
By default values in the resultant regular interval time series data sets are set to missing unless matched to times in the original time series data set (within the time window tolerance).
To convert irregular interval time series data to regular interval data by interpolation:

1. Choose the Time Functions tab of the Math Functions screen and select the Irregular to Regular operator, as shown above. Click Interpolate.
2. Select a data set to apply the function from the Selected Data Set pull-down list at the top of the screen or multiple data sets from the list in the lower portion of the screen. If you include the data set selected in the top Selected Data Set, the operation on that set will only be done once.
3. From the Time Interval list, select the time interval for the data sets.
4. Optionally, you may specify a Time Offset to offset the new points in time from the standard interval time. For example, if you select a daily interval for the Time Interval, you may use the option to offset time points to be at 6 a.m. instead of at midnight. If the Set Time Offset box is checked, enter an integer number in the box to the right and select the minute/hour/day/week/month/year time increment from the list further to the right. If the Set Time Offset box is unchecked, times in the resultant data sets will fall on the regular interval time (typical setting).
5. Click the Compute button to perform the interpolation.
To convert irregular interval time series data to regular interval data by snapping:
1. Choose the Time Functions tab of the Math Functions screen and select the Irregular to Regular operator. Click Snap.
2. Select a data set to apply the function from the Selected Data Set pull-down list at the top of the screen or multiple data sets from the list in the lower portion of the screen. If you include the data set selected in the top Selected Data Set, the operation on that set will only be done once.
3. From the Time Interval list, select the regular interval time period for the resultant time series data sets.
4. Optionally, you may specify a Time Offset to offset the new points in time from the standard interval time. For example, if you select a daily interval for the Time Interval, you may use the option to offset time points to be at 6 a.m. instead of at midnight. If the Set Time Offset box is checked, enter an integer number in the box to the right and select the minute/hour/day/week month/year time increment from the list further to the right. If the Set Time Offset box is unchecked, times in the resultant data sets will fall on the regular interval time (typical setting).
5. Use the Time Back and Time Forward offsets to define a time window around the regular interval time. If a time point from the selected time series data set falls within the time window, the data value is applied to the new regular interval time point. These offsets are set in the same manner as the Time Offset above.
6. Click Compute.
Regular to Irregular
The Regular to Irregular function derives new irregular interval time series data sets from existing regular interval time series data sets. No conversion, time shifting, or other operations are applied to the data. Embedded missing data values are retained in the irregular interval data sets.
The Irregular Block Size dictates how the data is stored in the HEC-DSS file. You should choose an irregular-interval block size, so that between 100 and 2,000 values are stored in a block. Data that occurs approximately on the average of once an hour should use a block size of "IR-MONTH". Data that occurs approximately on the average of once a day should use a block size of "IR-YEAR". Annual values should use a block size of "IR-DECADE".
To convert regular interval time series data to irregular interval data:

1.Choose the Time Functions tab of the Math Functions screen and select the Regular to Irregular operator, as shown above.
2. Select a data set to apply the function from the Selected Data Set pull-down list at the top of the screen or multiple data sets from the list in the lower portion of the screen. If you include the data set selected in the top Selected Data Set, the operation on that set will only be done once.
3. Select the Irregular Block Size for the data sets. Choose an irregular-interval block size, so that between 100 and 2,000 values are stored in a block. Data that occurs approximately on the average of once an hour should use a block size of "IR-MONTH". Data that occurs approximately on the average of once a day should use a block size of "IR-YEAR". Annual values should use a block size of "IR-DECADE".
4. Click Compute.
To Irregular using Pattern
The To Irregular using Pattern function generates a new time series data set from an existing irregular or regular interval time series data set. The times for the new time series are defined by the times of a second time series data set. Values for the new time series are computed from the original time series data using one of seven available functions. The functions are:
Interpolate at end of Period
Maximum for Period
Minimum for Period
Average over Period
Accumulation over Period
Volume for Period
Integration over Period
Number of Valid Data over Period
where "period" is the time between data points in the pattern data set.
The data type of the original time series data governs how values are interpolated. Data type "INST-VAL" (or "INST-CUM") considers the value to change linearly over the interval from the previous data value to the current data value. Data type "PER-AVER" considers the value to be constant at the current data value over the interval. Data type "PER-CUM" considers the value to increase from 0.0 (at the start of the interval) up to the current value over the interval. Interpolation of the three data types is illustrated below.
How interpolation is performed for a specific data type influences the computation of new values for the selected function. For example, if the data type is "INST-VAL", the function Maximum for Period is evaluated by:
■Finding the maximum value of the data points from the original time series that are inclusive in the new time interval.
■Linearly interpolate values at beginning and ending of the new time interval, and determine if these values represent the maximum over the interval.
Referring to the plots above, the Average over Period function is applied to a time series by integrating the area under the curve between interpolated points and dividing the result by the interval time.
The appearance of the Math Functions screen for the Transform to Irregular interval function is shown below.

To transform to an irregular interval time series data set:
1. Choose the Time Functions tab of the Math Functions screen and select the To Irregular using Pattern operator.
2. From the Selected Data Set list, select a time series data set.
3. From the Data Set for Time Pattern list, select a time series data set to provide the time pattern for the resultant time series.
4. From the Function Type list, select the method for computing new time series values.
5. Click Compute.
Extract Time Series
The Extract Time Series function selects/extracts data points from a regular or irregular interval time series data set based on user defined time specifications. For example, the function may be used to extract values observed every day at noon from hourly interval data.
Data may be extracted on the basis of one of the following time specifications: year, month of the year (January, February, etc.), day of month, day of week (Sunday, Monday, etc.), or time of day.
The appearance of the Math Functions screen for the Extract Time Series function is shown below.

To derive a new time series data set from the selected times of another time series data set:
1. Choose the Time Functions tab of the Math Functions screen and select the To Irregular using Pattern operator.
2. From the Selected Data Set list, select a time series data set to apply the function.
3. Choose one of the time levels, Year, Month, Day of Month, Day of Week, or Time of day and complete the boxes to the right. Entering or selecting a value in only the left-most box sets a time specification for data extraction to an individual year, month, day, or time of day. Fill in both boxes to specify a time range for data extraction.
4. Click Year to extract data for an individual year or range of years. To extract data for an individual year, fill the left-most box in with the desired year. To extract data for a range of years fill the left box with the beginning year and the right box with the ending year.
5. Click Month to extract data for an individual month of the year or range of months. Use the lists to set the month boxes. The list contains the months of the year, JAN to DEC. Set only the left-most box to extract data for a single month of the year. Set both boxes to extract data for a range of months. The range of months can be set to encompass the end of the year; that is, "OCT to FEB" is a valid setting.
6. Click Day of Month to extract data for an individual day or range of day of month days. The days are set using the two lists to the right. As above, the lists can be used to specify a single day of month, using the left-most pull down, or a range of days, using both lists. The day of month values range from 1 to 31, and "LastDay", the last day of the month, which may vary by month. The range of days can be set to encompass the end of the month. For example, for "27 to 4", data will be extracted from the 27th of one month to the 4th of the next month.
7. Click Day of Week to extract data for an individual or range of day of the weekdays. Select day from the two lists to the right. As above, you may use the lists to specify one day, using the left-most list, or a range of days, using both lists. The day of week values range from SUN to SAT. The range of days can be set to encompass the end of the week; that is, "SAT to MON" is a valid setting.
8. Click Time to extract data by the time of day. An individual time is specified by completing the left-most box only. Complete both boxes to specify a time of day range for data extraction. The time specification employs the standard four-digit military style 24-hour format (e.g. "2300" or "0310 to 0600"). The time range can encompass the end of day; that is, "2200 to 0330" is a valid setting. The optional Time Window box is applied to the time of day extraction only. The Time Window is an integer value in minutes, used to extend the beginning and ending of the time of day period for data extraction. For example, with a time of day extraction time of "0300" and a Time Window of "10 minutes", data will be extracted from the selected time series if times falls within in the period 0250 to 0310.
9. Select the Set as Irregular checkbox (recommended) to ensure the resultant time series data set is identified as irregular interval time series data. If the box is not checked, the function will attempt to determine if the extracted data set can be classified as regular interval time series data.