Math Functions
Math functions are accessible through the general class called HecMath. HecMath objects hold data sets and allow you to perform mathematical operations on them. They can also be passed to plots and tables to display the data. A HecMath object is either a TimeSeriesMath object or a PairedDataMath object, which handle time series and paired data sets, respectively.
Before using PairedDataMath methods, be sure to read the description for the setCurve method. Paired data sets may contain multiple curves. The setCurve method provides user control over which paired data curve is operated upon by subsequent function calls.
Absolute Value
abs()
Derive a new time series or paired data set from the absolute value of values of the current data set. For time series data, missing values are kept as missing. For paired data sets, use the setCurve method to first select the paired data curve(s).
See also: setCurve()
Parameters: Takes no parameters
Example: NewDataSet = dataSet.abs()
Returns: A new HecMath object of the same type as the current object
Accumulation (Running)
accumulation()
Derive a new time series by computing a running accumulation of the current time series.
For time points in which the current time series value are missing, the value in the accumulation time series remains constant (same as the accumulated value at the last valid point location).
Parameters: Takes no parameters
Example: NewTimeSeries = timeSeries.accumulation()
Returns: A new TimeSeriesMath object
Arccosine Trigonometric Function
acos()
Derive a new time series or paired data set from the arccosine of values of the current data set. The resultant data set values are in radians. For time series data, missing values are kept as missing.
For paired data sets, use the setCurve function to first select the paired data curve (or all curves) to apply the function. By default the function is applied to all paired data curves.
See also: setCurve()
Example: newDataSet = dataSet.acos()
Parameters: Takes no parameters
Returns: A HecMath object of the same type as the current object
Add a Constant
add(floating-point constant)
Add the value constant to all valid values in the current time series or paired data set. For time series data, missing values are kept as missing.
For paired data, constant is added to y-values only. Use the setCurve method to first select the paired data curve(s).
See also: add(HecMath dataSet)
setCurve()
Example: newDataSet = dataSet.add(2.5)
Parameters: constant - A floating-point value
Returns: A new HecMath object of the same type as the current object
Add a Data Set
add(TimeSeriesMath tsData)
Add the values in the data set tsData to the values in the current data set. The function only applies to time series data sets.
When adding one time series data set to another, there is no restriction that times in the two data sets match exactly. However, only values with coincident times will be added. Times in the current time series data set that cannot be matched with times in the second data set are set to missing. Values in the current data set that are missing are kept as missing. Either or both data sets may be regular or irregular interval time series. This function will not merge data sets. Use the mergeTimeSeries (for time series data sets) or the mergePairedData (for paired data sets) functions for this purpose.
See also: add(floating-point constant)
mergeTimeSeries(TimeSeriesMath)
mergePairedData(PairedDataMath)
Example: newTsData = tsData.add(otherTsData)
Parameters: tsData - A TimeSeriesMath object
Returns: A new TimeSeriesMath object
Apply Multiple Linear Regression Equation
applyMultipleLinearRegression(string startTimeString,
string endTimeString,
sequence tsDataSetSequence,
floating-point minimumLimit,
floating-point maximumLimit)
Apply the regression coefficients contained in the current paired data set to the array of time series data sets in tsDataSetSequence to develop a new time series data set. The applyMultipleLinearRegression function applies the multiple linear regression coefficients computed with the multipleLinearRegression function.
For the general linear regression equation, a dependent variable, Y, may be computed from a set independent variables, Xn:
Y = B0 + B1*X1 + B2*X2 + B3*X3
where Bn are linear regression coefficients.
For time series data sets, an estimate of the original time series data set values may be computed from a set of independent time series data sets using regression coefficients such that:
TsEstimate(t) = B0 + B1*TS1(t) + B2*TS2(t) + … + Bn*TSn(t)
where Bn are the set of regression coefficients and TSn are the time series data sets contained in tsDataSetSequence.
The number of regression coefficients in the current PairedDataMath object must be one more than the number of independent time series data sets in tsDataSetSequence. The collection of selected time series data sets must be in the same order as when the regression coefficients were computed with the multipleLinearRegression method.
All the time series data sets must be regular interval and have the same time interval. The function filters the data to determine the time period common to all time series data sets and uses only those points in the regression analysis. For any given time, if a value is missing in any time series, the value in resultant time series is set to missing.
The parameters minimumLimit and maximumLimit can be used to specify the range of valid values for the resultant data set. Values which fall outside the specified range are set to missing. minimumLimit or maximumLimit may be entered as Constants.UNDEFINED to ignore the minimum or maximum value check.
If startTimeString or endTimeString are blank strings, the start and end time of the resultant time series will be defined by the time period common to all time series data sets in tsDataSetSequence. Otherwise the time series start and end may be defined using startTimeString and endTimeString which have the usual HEC time window format (e.g. "01JAN2001 1400").
Names, parameter type and unit labels for the new time series data set are copied over from the first time series data set in tsDataSetSequence. The F-part in the new data set is set to "COMPUTED".
Parameters:
startTimeString – A string containing an HEC time (e.g. "01JAN2001 1400") specifying the start time of the resultant time series data set. May be blank (" ")
endTimeString – A string containing an HEC time (e.g. "01JAN2001 1400") specifying the ending time of the resultant time series data set. May be blank (" ")
tsDataSetSequence – Sequence of TimeSeriesMath objects. Must all be regular interval and have the same time interval.
minimumLimit – A floating-point value specifying the minimum valid value in the resultant time series data set. Set to Constants.UNDEFINED to ignore this option.
maximumLimit – A floating-point value specifying the maximum valid value in the resultant time series data set. Set to Constants.UNDEFINED to ignore this option.
Example:
newTsData =
pairedData.applyMultipleLinearRegression(
"01Jan2000 0000",
"31Dec2000 2300",
(tsData1, tsData2, tsData3),
Constants.UNDEFINED,
Constants.UNDEFINED)
Returns: A new regular interval TimeSeriesMath object
Generated Exceptions: Throws a HecMathException if the number of data sets in tsDataSetSequence is not equal to the number of regression coefficients -1, or if the data sets in tsDataSetSequence are not regular interval time series data sets with the same interval time.
Arcsine Trigonometric Function
asin()
Derive a new time series or paired data set from the arcsine of values of the current data set. The resultant data set values are in radians. For time series data, missing values are kept as missing.
For paired data sets, use the setCurve function to first select the paired data curve (or all curves) to apply the function. By default the function is applied to all paired data curves.
See also: setCurve()
Example: newDataSet = dataSet.asin()
Parameters: Takes no parameters
Returns: A HecMath object of the same type as the current object
Arctangent Trigonometric Function
atan()
Derive a time series or paired data set computed from the arctangent of values of the current data set. For time series data, missing values are kept as missing. If the cosine of the current time series value is zero, the value is set missing.
For paired data sets, use the setCurve method to first select the curve(s).
See also: setCurve()
Example: newDataSet = dataSet.atan()
Parameters: Takes no parameters
Returns: A new HecMath object of the same type as the current object
Ceiling Function
ceil()
Derive a time series or paired data set with values of the current time series rounded up to the nearest whole number that is greater to or equal to the value. For time series data, missing values are kept as missing.
For paired data sets, use the setCurve method to first select the curve(s).
See also: setCurve(), floor()
Example: newDataSet = dataSet.ceil()
Parameters: Takes no parameters
Returns: A new HecMath object of the same type as the current object
Centered Moving Average Smoothing
centeredMovingAverage(integer numberToAverageOver,
boolean onlyValidValues,
boolean useReduced)
Derive a new time series from the centered moving average of numberToAverageOver values in the current time series. numberToAverageOver must be an odd integer greater than two.
If onlyValidValues is set to true, then if any points in the averaging interval are missing, the point in the new time series is set to missing. If onlyValidValues is set to false and missing values are contained in the averaging interval, a smoothed point is still computed using the remaining valid values in the interval. If there are no valid values in the averaging interval, the point is set to missing.
If useReduced is set to true, then centered moving average points can still be computed at the beginning and end of the time series, even if there are less than numberToAverageOver values in the averaging interval. If useReduced is set to false, then the first and last numberToAverageOver/2 points of the resultant time series are set to missing.
Parameters:
numberToAverageOver – An integer containing the number of values to average over for computing the centered moving average. Must be odd and greater than two.
onlyValidValues – Either True or False, specifying whether all values in the averaging interval must be valid for the computed point in the new time series to be valid.
useReduced – Either True or False, specifying whether to allow points at the beginning and end of the resultant time series to be computed from a reduced ( less than numberToAverageOver) set of points.
Example:
avgData = tsData.centeredMovingAverage (5, TRUE, TRUE)
Returns: A new TimeSeriesMath object
Generated Exceptions: Throws a HecMathException if the numberToAverageOver is less than three or not odd.
Conic Interpolation from Elevation/Area Table
conicInterpolation(TimeSeriesMath tsData,
string inputType,
string outputType,
floating-point storageScaleFactor )
Use the conic interpolation table in the current paired data set to develop a new time series data set from the interpolation of tsData.
The current paired data should be an Elevation-Area table. However, the first data pair is the initial conic depth, and the storage value at the first elevation in the table. If the initial conic depth is undefined, the function will calculate a value. Elevation-Area values in the table must be in ascending order.
tsData is either a time series of reservoir elevation or storage. The type is specified by setting inputType as "S(TORAGE)" or "E(LEVATION)". The desired output time series type is similarly set using outputType. The valid settings for outputType are "S(TORAGE)", "E(LEVATION)" or "A(REA)". inputType and outputType must not be the same.
storageScaleFactor is an optional parameter used to scale input (by multiplying) and output (by dividing) storage values. For example, if the area in the conic interpolation table is expressed in square feet, storageScaleFactor could be set to 43,560 to convert the storage output to acre-feet.
Parameter type in the new time series is set according to outputType. If the output time series values are elevation, the time series units are set to the paired data x-units label. If the output time series values are area, the time series units are set to the paired data y-units label. If the output is storage, the units are not set and should be set by the user with the setUnits function.
See also: setUnits()
Parameters:
tsData – A TimeSeriesMath object representing elevation or storage.
inputType – A string specifying the parameter type for the input time series, either "S(TORAGE)" or "E(LEVATION)". Only the first character of the string is interpreted by the function.
outputType – A string specifying the parameter type for the output time series, either "S(TORAGE)", "E(LEVATION)" or "A(REA)". Only the first character of the string is interpreted by the function.
storageScaleFactor – A floating-point number used to scale input (by multiplying) and output (by dividing) storage values.
Examples:
tsStorage =
conicElevAreaCurve.conicInterpolation(
tsElev,
"Elevation",
"Storage",
1.0)
tsArea =
conicElevAreaCurve.conicInterpolation(
tsElev,
"Elevation",
"Area",
1.0)
Returns: A new TimeSeriesMath object
Generated Exceptions: Throws a hec.hecmath.HecMathException if inputType or outputType cannot be interpreted as one of the allowed values; if inputType and outputType are the same parameters; if values in the conic interpolation table are not in ascending order.
Convert Values to English Units
convertToEnglishUnits()
Perform unit conversion of data values and unit labels in the current time series or paired data set from Metric (SI) units to English units. Determination of the unit system will be based upon the current units labels and parameter types. If the data units are already in English units or the unit system cannot be determined, no conversion occurs.
For paired data, both x and y values are converted. For time series data, missing values remain missing.
See also: convertToMetricUnits(), isEnglish(), isMetric()
Example: englishDataSet= siDataSet.convertToEnglishUnits()
Parameters: Takes no parameters
Returns: A HecMath object of the same type as the current object
Convert Values to Metric (SI) Units
convertToMetricUnits()
Perform unit conversion of data values and unit labels in the current time series or paired data set from English units to Metric (SI) units. Determination of the unit system will be based upon the current units' labels and parameter types. If the units are already in Metric units or the unit system cannot be determined, no conversion occurs.
For paired data, both x and y values are converted. For time series data, missing values remain missing.
See also: convertToEnglishUnits(), isEnglish(), isMetric()
Parameters: Takes no parameters
Example: siDataSet = englishDataSet.convertToMetricUnits()
Returns: An HecMath object of the same type as the current object
Correlation Coefficients
correlationCoefficients(TimeSeriesMath tsData)
Computes the linear regression and other correlation coefficients between data in the current time series and tsData. Values in the current time series and tsData are matched by time to form data pairs for the correlation analysis. The data sets may be either regular or irregular time interval data.
The correlations statistics computed by the function are:
Number of Valid Values
Regression Constant
Regression Coefficient
Determination Coefficient
Standard Error of Regression
Adjusted Determination Coefficient
Adjusted Standard Error of Regression
These values are contained in a LinearRegressionStatistics object. The current TimeSeriesMath object forms the values of the independent variable (x-values), while values of the second time series comprise the dependent variable (y-values). The linear regression coefficients thus express how values in the second data set can be derived from values in the primary data set:
TS2(t) = a + b * TS1(t)
where "a" is the regression constant and "b" the regression coefficient.
See also: LinearRegressionStatistics
Parameters: tsData - A TimeSeriesMath object that forms the dependent variable for the regression analysis
Example:
linearRegressionData =
tsData.correlationCoefficients(otherTsData)
Returns: A LinearRegressionStatistics object holding the correlation data.
Generated Exceptions: Throws an hec.hecmath.HecMathException if the times in the current time series do not exactly match times in tsData.
Cosine Trigonometric Function
cos()
Derive a new time series or paired data set from the cosine of values of the current data set. The resultant data set values are in radians. For time series data, missing values are kept as missing.
For paired data sets, use the setCurve function to first select the paired data curve (or all curves) to apply the function. By default the function is applied to all paired data curves.
See also: setCurve()
Example: newDataSet = dataSet.cos()
Parameters: Takes no parameters
Returns: A HecMath object of the same type as the current object
Cyclic Analysis (Time Series)
cyclicAnalysis()
Derive a set of cyclic statistics from the current regular interval time series data set. The time series data set must have a time interval of "1HOUR", "1DAY" or "1MONTH". The function sorts the time series values into statistical "bins" relevant to the time interval. Values for the 1HOUR interval data are sorted into twenty-four bins representing the hours of the day, 0100 to 2400. The 1DAY interval data is apportioned to 365 bins for the days of the year. The 1MONTH interval data is sorted into tweleve bins for the months of the year.
The format of the resultant data sets is as a "pseudo" time series for the year 3000. For example, the cyclic analysis of one month of hourly interval data will produce pseudo time series data sets having twenty-four
hourly values for the day January 1, 3000. If the statistical parameter is the "maximum" value, then the twenty-four values represent the maximum value occurring at that hour of the day in the current time series. The cyclic analysis of daily interval data will produce pseudo time series data sets having 365 daily values for the year 3000. The cyclic analysis of monthly interval data will result in pseudo time series data sets having twelve monthly values for the year 3000.
Fourteen pseudo time series data sets are derived by the cyclic analysis function for the following statistical parameters:
Number of values processed for each time interval
Maximum value
Time of maximum value
Minimum value
Time of minimum value
Average value
Probability exceedence percentiles for 5%, 10%, 25%, 50% (median value), 75%, 90%, and 95%
Standard deviation
The fourteen pseudo time series of cyclic statistics are returned by the function as an array of time series data sets. The parameter part of the record path for each time series is modified to indicate the type of the statistical parameter. For a flow record, the parameter "FLOW" would become "FLOW-MAX" for the maximum values statistics, "FLOW-P5" for the five percent percentile statistics, etc.
Parameters: Takes no parameters
Example: cyclicData = tsData.cyclicAnalysis()
Returns: A sequence of fourteen TimeSeriesMath objects, each of which is a pseudo time series data sets representing a statistical parameter.
Generated Exceptions: Throws a hec.hecmath.HecMathException if the time series is not regular interval or does not have a time interval of "1HOUR", "1DAY", or "1MONTH".
Decaying Basin Wetness Parameter
decayingBasinWetnessParameter(TimeSeriesMath tsPrecip, floating-point decayRate)
Compute a time series of decaying basin wetness parameters from the regular interval time series data set of incremental precipitation, tsPrecip, by:
TSResult(t) = Rate * TSResult(t-1) + TSPrecip(t)
where Rate is decayRate, and 0 < Rate < 1.
The first value of the resultant time series data set, TSResult(1), is set to the first value in the current time series data set. The current time series data set can be the same time series data set as tsPrecip. Missing values in the precipitation time series are taken as zero when applying the above equation.
Parameters:
tsPrecip – A regular interval TimeSeriesMath object representing precipitation
decayRate – a floating-point number in the range 0 < decayRate < 1.
Example:
tsWetness =
tsPrecip.decayingBasinWetnessParameter(
tsPrecip,
0.87)
Returns: A new TimeSeriesMath object
Divide by a Constant
divide(floating-point constant)
Divide all valid values in the current time series or paired data set by the value constant. For time series data, missing values are kept as missing. For paired data, constant divides the y-values only. Use the setCurve method to select the paired data curve(s).
See also: divide(TimeSeriesMath tsData); setCurve()
Parameters:
constant - A floating-point value to divide the values in the current data set (cannot be zero)
Example: newDataSet = dataSet.divide(1.1)
Returns: A new HecMath object of the same type as the current object
Divide by a Data Set
divide(TimeSeriesMath tsData)
Divide valid values in the current data set by the corresponding values in the data set tsData. Both data sets must be time series data sets.
When dividing one time series data set by another, there is no restriction that times in the two data sets match exactly. However, only values with coincident times will be divided. Times in the current time series data set that cannot be matched with times in the second data set are set to missing. Values in the current data set that are missing are kept as missing. If a value in the second data set is zero or missing, the value in the resultant data set is set to missing (divide by zero not allowed). Either or both data sets may be regular or irregular interval time series.
See also: divide(floating-point constant)
Parameters: tsData - A time series data set
Example: newTsData = tsData.divide(otherTsData)
Returns: A new TimeSeriesMath object
Estimate Values for Missing Precipitation Data
estimateForMissingPrecipValues(integer maxMissingAllowed)
Linearly interpolate estimates for missing values in the current regular or irregular interval time series data set. The current data set is expected to be cumulative precipitation and the data must be of type "INST-CUM". Use the estimateForMissingValues method for filling missing values in other types of time series data.
The rules used for interpolation of missing cumulative precipitation data are:
■ If the values bracketing the missing period are increasing with time, only interpolate if the number of successive missing values does not exceed the value of maxMissingAllowed.
■ If the values bracketing the missing period are decreasing with time, do not estimate for any missing values.
■ If the values bracketing the missing period are equal, then estimate any number of missing values.
See also: estimateForMissingValues()
Parameters: maxMissingAllowed - an integer value for the maximum number of consecutive missing values between valid values
Example:
newPrecip =tsPrecip.estimateForMissingPrecipValues(5)
Returns: A new TimeSeriesMath object
Estimate Values for Missing Data
estimateForMissingValues(integer maxMissingAllowed)
Linearly interpolate estimates for missing values in the current regular or irregular interval time series data set. Do not interpolate if the number of successive missing values exceeds maxMissingAllowed.
See also: estimateForMissingPrecipValues()
Parameters: maxMissingAllowed - an integer value for the maximum number of consecutive missing values allowed for interpolation
Example: newTsData = tsData.estimateForMissingValues(5)
Returns: A new TimeSeriesMath object
Exponent
exp()
Derive a new time series or paired data set which is the e raised to the values of the current time series. For time series data, values that are missing in the current time series remain missing in the new time series. Also, values less than 0.0 will be set to missing the new time series.
For paired data sets, use the setCurve method to first select the paired data curve(s).
See also: setCurve()
Parameters: Takes no parameters
Example: squaredDataSet = dataSet.exp()
Returns: A new HecMath object of the same type as the current object
Exponentiation Function
exponentiation(floating-point constant)
Derive a new time series or paired data set from the exponentiation of values in the current data set by constant, by:
T2 ![]() = T1
= T1![]() constant
constant
For time series data, values that are missing in the current time series remain missing in the new time series.
For paired data sets, use the setCurve method to first select the paired data curve(s).
See also: setCurve()
Parameters: constant – a floating-point value representing the exponent.
Example: squaredDataSet = dataSet.exponentiation(2.)
Returns: A new HecMath object of the same type as the current object
Exponentiation Timeseries Function
exponentiation(HecMath tsMath)
Raise values in the current time series to the power of the parameter time series, tsMath. A new time series will be created which duplicates the time points of the current time series. Where time points match for the current time series and tsMath, the value in the current timeseries will be raised to the power of the value in tsMath provided both values are valid (not missing). Points in the current time series which cannot be matched to valid points in tsMath are set to missing. Values in the current time series which are missing remain missing in the new time series.The new time series will always have quality defined. If a specific quality value in the parameter time series is questionable or rejected, that quality will be copied to the new time series.
Parameters: tsMath the time series of exponents for the current time series.
Example: squaredDataSet = dataset.exponentiation(HecMath tsMath)
Returns: a new time series resulting from the subtraction operation.. Derive a new time series or paired data set from the exponentiation of values in the current data set by constant, by:
T2 ![]() = T1
= T1![]() constant
constant
For time series data, values that are missing in the current time series remain missing in the new time series. For paired data sets, use the setCurve method to first select the paired data curve(s).
See also: setCurve()
Parameters: constant – a floating-point value representing the exponent.
Example: squaredDataSet = dataSet.exponentiation(2.)
Returns: A new HecMath object of the same type as the current object.
Extract Time Series Data at Unique Time Specification
extractTimeSeriesDataForTimeSpecification(
string timeLevelString,
string rangeString,
boolean isInclusive,
integer intervalWindow,
boolean setAsIrregular )
Select/extract data points from the current regular or irregular interval time series data set based upon user defined time specifications. For example, the function may be used to extract from hourly interval data, the values observed every day at noon.
timeLevelString defines the time level/interval for extraction (year, month, day of the month, day of the week, or twenty-four hour time).
rangeString defines the interval range for data extraction applicable to the time level. For example, if timeLevelString is "MONTH", a valid range would be "JAN-MAR". The rangeString variable can define a single interval value (e.g. "JAN" - select data from January only) or a beginning and ending range (e.g. "JAN-MAR" - select data for January through March). The valid timeLevelString and rangeString values are shown below.
Valid timeLevelString and rangeString Values
timeLevelString | rangeString | Example rangeString |
"YEAR" | Four-digit year value | "1938" or "1938-1945" |
"MONTH" | Standard three-character abbreviation for month | "JAN" or "JAN-MAR" |
"DAYMON(TH)" | Day of the month or "LASTDAY" string | "15" or "1-15 or "27-5" |
"DAYWEE(K)" | Standard three-character abbreviation for day of the week | "MON" or "SUN-TUE" |
"TIME" | Four digit 24-hour military-style clock time | "2400" or "0300-0600" |
If desired, you may use one of the enumerated string constants to specify timeLevelString:
Year TimeSeriesMath.LEVEL_YEAR_STRING
MonthTimeSeriesMath. LEVEL_MONTH_STRING
Day of MonthTimeSeriesMath. LEVEL_DAYMONTH_STRING
Day of WeekTimeSeriesMath.LEVEL_DAYWEEK_STRING
24-hour timeTimeSeriesMath.LEVEL_TIME_STRING
The parameter isInclusive determines whether the data extraction operation is either inclusive or exclusive of the specified range. For example, if isInclusive is "True" and the range is set to "JAN-MAR" for the "MONTH" time level, the extracted data will include all data in the months January through March for all the years of time series data. If isInclusive is "False" for this example, the extracted data covers the time April through December (is exclusive of the period January through March).
intervalWindow is only used when the timeLevelString is "TIME." intervalWindow is the minutes before and after the time of day within which the data will be extracted. intervalWindow effectively increases the time range at the beginning and end intervalWindow minutes. For example, with a rangeString of "0300" and an intervalWindow of 10, data will be extracted from the selected time series if times falls within in the period 0250 to 0310.
setAsIrregular defines whether the extracted data is saved as regular interval or irregular interval data. Most often the time series data formed by the extraction process will no longer be regular interval, and setAsIrregular should be set to "True". Setting setAsIrregular to "False" will force an attempt to save the data as regular interval time data.
Parameters:
timeLevelString – A string specifying the time level selection.
rangeString – A string specifying time or time range for selection. Must be consistent with timeLevelString.
isInclusive – Either True or False, value. If true, data is extracted inclusive of the range specified by rangeString. If false, data is extracted exclusive of the range specified by rangeString.
intervalWindow – An integer value representing the minutes before and after the time of day within which the data will be extracted. Only applied when the timeLevelString is "TIME".
setAsIrregular – Either True orFalse, value. If true, data is automatically set as irregular time interval data. If false, the function will attempt to classify the data as regular time interval data.
Example:
SelectedData =
tsData.extractTimeSeriesDataForTimeSpecification(
"DAYMONTH",
"16-LASTDAY",
TRUE,
0,
TRUE)
Returns: A new TimeSeriesMath object
Generated Exceptions: Throws a hec.hecmath.HecMathException if the function could not successfully interpret timeLevelString or rangeString.
First Valid Date
firstValidDate()
Find the date and time of the first valid time series value
See also: firstValidValue()
Parameters: Takes no parameters
Example: squaredDataSet = dataSet.firstValidDate()
Returns: An integer representing the date and time of the first valid value as an integer value translatable by HecTime.
First Valid Value
firstValidValue()
Find the first valid value in the time series
See also: firstValidDate()
Parameters: Takes no parameters
Example: squaredDataSet = dataSet.firstValidValue ()
Returns: The floating-point value of the first valid time series value
Floor Function
floor()
Derive a time series or paired data set with values of the current time series rounded down to the nearest whole number that is less than or equal to the value. For time series data, missing values are kept as missing.
For paired data sets, use the setCurve method to first select the curve(s).
See also: setCurve(), ceil()
Example: newDataSet = dataSet.floor()
Parameters: Takes no parameters
Returns: A new HecMath object of the same type as the current object
Flow Accumulator Gage (Compute Period Average Flows)
flowAccumulatorGageProcessor(TimeSeriesMath tsCounts)
Derive a new time series of period-average flows from a flow accumulator type gage. The current time series is assumed to containe the accumulated flow data, while the parameter time series, tsCounts, is assumed to have the corresponding time series of counts. The two time series data sets must match times exactly. The two time series are combined to compute a new time series of period average flow:
TsNew(t) = (TsAccFlow(t) - TsAccFlow(t-1) ) / ( TsCount(t) - TsCount(t-1))
where TsAccFlow is the gage accumulated flow time series and TsCount is the gage time series of counts.
In the above equation, if TsAccFlow(t), TsAccFlow(t-1), TsCount(t) or TsCount(t-1) are missing, TsNew(t) is set to missing. The new time series is assigned the data type "PER-AVER".
Parameters: tsCounts – A TimeSeriesMath object containing the counts.
Example:
tsPerAvgFlow =
tsAccumFlow.flowAccumulatorGageProcessor(tsCounts)
Returns: A new TimeSeriesMath object.
Generated Exceptions: Throws a hec.hecmath.HecMathException if times in the current object do not exactly match the times in tsCounts.
Modulo Function with both Arguments are Greater than Zero
fmod(HecMath tsMath)
Return the remainder of integer division of current time series by the parameter time series, tsMath. A new time series will be created which duplicates the time points of the current time series, where time points match for the current time series and tsMath, the value in the current time series will be devided by the value in tsMath provided both values are valid (no missing). Devide by zero is not allowed.When the tsMath time series value is zero, the value for the new time series will be set to missing. Also, points in the current time series which can not be match to valid points in tsMath are set to missing. For time series data, missing values are kept as missing. The new time series will always have quality defined. If a specific quality value in the parameter time series is questionable or rejected, that quality will be copied to the new time series.
For paired data sets, use the setCurve method to first select the curve(s).
See also: setCurve(),modulo()
Parameters:
tsMath the time series to be divided into the current time series.
constant – a floating-point value representing the exponent.
Example: squaredDataSet = dataSet.fmod(2.)
Returns: A new HecMath object of the same type as the current object.
Forward Moving Average Smoothing
forwardMovingAverage(integer numberToAverageOver)
Derive a new time series from the forward moving average of numberToAverageOver values in the current time series. numberToAverageOver must be an integer greater than two. If the averaging interval contains a missing value, the smoothed value is computed from the remaining valid values in the interval. However, if there are less than two valid values in the interval, the value in the resultant data set is set to missing.
Parameters: numberToAverageOver – An integer containing the number of values to average over for computing the forward moving average.
Example: tsAveraged = tsData.forwardMovingAverage(4)
Returns: A new TimeSeriesMath object.
Generated Exceptions: Throws a hec.hecmath.HecMathException if the numberToAverageOver is less than two.
Forward Moving Average Smoothing of Time Series
forwardMovingAverage(integer numberToAverageOver, Boolean onlyValidValues, Boolean useReduced)
Derive a new time series from the forward moving average of the last numberToAverageOver values of the current time series. If onlyValidValues is set to true, then if points in the averaging interval are missing values, the point in the new time series is set to missing. If onlyValidValues is set to false and missing values are contained in the averaging interval, a smoothed point is still computed using the valid values in the interval. If there are no valid values in the averaging interval, the point in the new time series is set to missing.
If useReduced is set to true, then forward moving average points can be still be computed at the beginning of the time series even if there are less than numberToAverageOver values in the interval. If useReduced is set to false, then the first numberToAverageOver points of the new time series are set to missing.
Parameters:
numberToAverageOver – An integer containing the number of values to average over for computing the forward moving average.
onlyValidValues – Either True or False, specifying whether all values in the averaging interval must be valid for the computed point in the new time series to be valid.
useReduced – Either True or False, specifying whether to allow points at the beginning and end of the resultant time series to be computed from a reduced ( less than numberToAverageOver) set of points.
Example: tsAveraged = tsData.forwardMovingAverage (4,TRUE,TRUE)
Returns: A new time series computed from the forward moving average of current time series.
Generated Exceptions: Throws a hec.hecmath.HecMathException if the numberToAverageOver is less than two.
Generate Paired Data from Two Time Series
generatePairedData(TimeSeriesMath tsData, Boolean sort)
Generate a paired data set by pairing values (by time) from the current time series data set and the time series data set tsData. The values of the current time series form the x-ordinates, while values from tsData form the y-ordinates of the resulting paired data set. The times in the two time series data sets must match exactly. If a value for a time is missing in either time series, no data value pair is formed or added to the paired data set. If sort is "True", data pairs in the paired data set are sorted by ascending x-value.
The units and parameter type from the current time series data set are assigned to the paired data set x-units and x-parameter type. The units and parameter type from tsData are assigned to the paired data set y-units and y-parameter type.
An example application of the function would be to mate a time series record of stage to one of flow to generate a stage-flow paired data set.
Parameters:
tsData – A TimeSeriesMath object that forms the y-ordinates of the resulting paired data set.
sort – Either True or False, value. If true, sort data pairs in ascending x-value. If false, leave unsorted.
Example: ratingCurve = tsStage.generatePairedData(tsFlow)
Returns: A PairedDataMath object with x-ordinates from the current time series, and y-ordinates from tsData.
Generated Exceptions: Throws a hec.hecmath.HecMathException if times from the current time series and tsData do not match exactly.
Generate a Regular Interval Time Series
generateRegularIntervalTimeSeries(string startTimeString,
string endTimeString,
string timeIntervalString,
string timeOffsetString,
floating-point initialValue)
Generate a new regular interval time series data set from scratch with times and values specified by the parameters. This is a function provided by the TimeSeriesMath module, and not an object method.
The parameters startTimeString and endTimeString are strings used to specify the beginning and ending time of the generated data set. These two parameters have the form of the standard HEC time string (e.g. "01JAN2001 0100").
The regular time interval is specified by timeIntervalString, and is a valid HEC time increment string (e.g. "1MIN", "15MIN", "1HOUR", "6HOUR", "1DAY", "1MONTH").
timeOffsetString is used to shift times in the resultant time series from the standard interval time. As an example, the offset could be used to shift times in regular hourly interval data from the top of the hour to six minutes past the hour. The parameter has the form "nT", where "n" is an integer number and "T" is one of the time increments: "M(INUTES)", "D(AYS)", "H(OUR)", "W(EEKS)", "MON(THS)" or "Y(EARS)" ( characters in the parenthesis are optional ). For example, a time offset of nine minutes would be expressed as "9M" or "9MIN".
Values in the time series data set are initialized to initialValue.
Parameters:
startTimeString - a string specifying a standard HEC time defining the time series data start date/time.
endTimeString - a string specifying a standard HEC time defining the time series data end date/time.
timeIntervalString - a string specifying a valid DSS regular time interval which defines the time interval of the new time series.
timeOffsetString – a string specifying the offset of the new time points from the regular interval time. This string may be an empty string or None.
initialValue - a floating-point number set to the initial value for all time series points. Set to HecMath.UNDEFINED to set all values to missing.
Example:
newTsData=TimeSeriesMath.generateRegularIntervalTimeSeries(
"01FEB2002 0100",
"28FEB2002 2400",
"1HOUR",
"0M",
100.)
Returns: A new regular interval TimeSeriesMath object initialized to initialValue. Data units and type are unset.
Generated Exceptions: Throws a hec.hecmath.HecMathException if time parameters cannot be successfully interpreted.
Get Data Container
getData()
Returns a copy of the hec.io.DataContainer for the current data set. For time series data sets, returns a hec.io.TimeSeriesContainer. For paired data sets, returns a hec.io.PairedDataContainer.
The hec.io.TimeSeriesContainer contains the time series values for a time series data set. The hec.io.PairedDataContainer contains the paired data values for a paired data set.
Parameters: Takes no parameters
Example: container = dataset.getData()
Returns: A hec.io.DataContainer
Get Data Type for Time Series Data Set
getType()
Get the data type for a time series data set.
Parameters: Takes no parameters
Example: dataSet.getType()
Returns: A string - "INST-CUM", "INST-VAL", "PER-AVER" or "PER-CUM".
Get Units Label for Data Set
getUnits()
Get the units label of the current data set. For a paired data set, returns the y-units label.
Parameters: Takes no parameters
Example: dataSet.getUnits()
Returns: A string
Gmean
gmean(list of HecMath tsMathArray)
Determine the geometric mean of the current time series and the each time series in the parameter, tsMathArray. A new time series will be created which duplicates the time points of the current time series. Where time points match for the current and tsMathArray, the values will be the geometric mean of all time series for that time, provided the values for all time series are valid values (not missing). Points in the current time series which cannot be matched to valid points in tsMathArray are set to missing. Values in the current time series which are missing remain missing in the new time series.
The new time series will always have quality defined. For a specific time, if any of the quality values in the current or parameter time series is questionable or rejected, the quality value for that time in the new time series will be set to the most severe quality for that time (e.g. if questionable and rejected are both encountered, the new quality will be set to rejected.)
Parameters: tsMathArray the array of time series to be compared with the current time series.
Example: newDataSet = dataSet. gmean(list of HecMath tsMathArray)
Returns: a new time series representing the geometric mean of all time series.
Hmean
hmean(list of HecMath tsMathArray)
Determine the harmonic mean of the current time series and the each time series in the parameter, tsMathArray. A new time series will be created which duplicates the time points of the current time series. Where time points match for the current and tsMathArray, the values will be the harmonic mean of all time series for that time, provided the values for all time series are valid values (not missing). Points in the current time series which cannot be matched to valid points in tsMathArray are set to
missing. Values in the current time series which are missing remain missing in the new time series.
The new time series will always have quality defined. For a specific time, if any of the quality values in the current or parameter time series is questionable or rejected, the quality value for that time in the new time series will be set to the most severe quality for that time (e.g. if questionable and rejected are both encountered, the new quality will be set to rejected.)
Parameters: tsMathArray the array of time series to be compared with the current time series.
Example: newDataSet = dataSet. hmean(list of HecMath tsMathArray)
Returns: a new time series representing the harmonic mean of all time series.
Integer Division by a Constant
integerDivide(floating-point constant)
Divide values in the current time series by a constant and truncate the result to an integer value. Times in which values are missing in the current time series remain missing in the new time series.
Parameters: constant the value to divide values in current time series.
Example: dataSet.integerDivide(2.0)
Returns: a new time series resulting from the integer division operation.
Integer Divison by an Object
integerDivide(HecMath tsMath)
Divide the current time series by the parameter time series, tsMath and truncate the result to an integer value. A new time series will be created which duplicates the time points of the current time series. Where time points match for the current time series and tsMath, the value in the current time series will be divided by the value in tsMath provided both values are valid (not missing). Divide by zeroes are not allowed. When the tsMath time series value is zero, the value for the new time series will be set to missing. Points in the current time series which cannot be matched to valid points in tsMath are set to missing. Values in the current time series which are missing remain missing in the new time series.
The new time series will always have quality defined. If a specific quality value in the parameter time series is questionable or rejected, that quality will be copied to the new time series.
Parameters: tsMath the time series to be divided into the current time series.
Example: newDataSet = dataset.integerDivide(HecMath tsMath)
Returns: a new time series resulting from the integer division operation.
Interpolate Time Series Data at Regular Intervals
interpolateDataAtRegularInterval(
string timeIntervalString,string timeOffsetString)
Derive a regular interval time series data set by interpolation of the current regular or irregular interval time series data set.
The new time interval is set by timeIntervalString which must be a valid HEC time interval string (e.g. "1MIN", "15MIN", "1HOUR", "6HOUR", "1DAY", "1MONTH").
Times in the resultant time series may be shifted (offset) from the regular interval time by the increment specified by timeOffsetString. As an example, the offset could be used to shift times from the top of the hour to six minutes past the hour. If no offset is used timeOffsetString should be a blank or empty string.
Whether the time series data type is "INST-VAL", "INST-CUM", "PER-AVE", or "PER-CUM" controls how the interpolation is performed. Interpolated values are derived from "INST-VAL" or "INST-CUM" data using linear interpolation. Values are derived from "PER-AVE" data by computing the period average value over the time interval. Values are derived from "PER-CUM" data by computing the period cumulative value over the new time interval.
For example, if the original data set is hourly data and the new regular interval data set is to have a six hour time interval:
The value for "INST-VAL" or "INST-CUM" type data is computed from the linear interpolation of the hourly points bracketing the new six hour time point.
The value for "PER-AVE" type data is computed from the period average value over the six hour interval.
The value for "PER-CUM" type data is computed from the accumulated value over the six hour interval.
The treatment of missing value data is also dependent upon data type. Interpolated "INST-VAL" or "INST-CUM" points must be bracketed or coincident with valid (not missing) values in the original time series; otherwise the interpolated values are set as missing. Interpolated "PER-AVE" or "PER-CUM" data must contain all valid values over the interpolation interval; otherwise the interpolated value is set as missing.
Parameters:
timeIntervalString – A string specifying the regular time interval for the resultant time series.
timeOffsetString – A string specifying the offset of the new time points from the regular interval time. This variable may be an empty string (" ").
Example:
newTsData =
tsData.interpolateDataAtRegularInterval(
"15MIN",
" ")
Returns: A new regular interval TimeSeriesMath object.
Inverse (1/X) Function
inverse()
Derive a new time series or paired data set from the inverse (1/x) of values of the current data set. The inverse value is computed by 1.0 divided by the value of the current data set. If a data value is equal to 0.0, the value in the resultant data set is set to missing. For time series data, if the original value is missing, the value remains missing in the resultant data set.
For paired data sets, use the setCurve method to first select the paired data curve(s).
See also: setCurve()
Parameters: Takes no parameters
Example: newDataSet = dataSet.inverse()
Returns: A HecMath object of the same type as the current object.
Determine if Data is in English Units
isEnglish()
Determine if the current time series or paired data set is in English units. The function examines the data set parameter type and units label to establish the unit system.
See also: isMetric(); convertToEnglishUnits()
Parameters: No parameters
Example: if dataSet.isEnglish() : print "English Units"
Returns: True if the data set units are English, otherwise False.
Generated Exceptions: Throws a hec.hecmath.HecMathException if the unit system cannot be determined (parameter type and units label undefined).
Determine if Data is in Metric Units
isMetric()
Determine if the current time series or paired data set is in Metric (SI) units. The function examines the data set parameter type and units label to establish the unit system.
See also: isEnglish(); convertToMetricUnits()
Parameters: Takes no parameters
Example: if dataSet.isMetric() : print "SI Units"
Returns: True if the data set units are Metric, otherwise False.
Generated Exceptions: Throws a hec.hecmath.HecMathException if the unit system cannot be determined (parameter type and units label undefined).
Determine if Computation Stable for Given Muskingum Routing Parameters
isMuskingumRoutingStable(integer numberSubreaches,
floating-point muskingumK,
floating-point muskingumX)
Check for possible instability for the given Muskingum Routing parameters.
Test if the input parameters satisfy the stability criteria:
1/(2(1-x)) <= K/deltaT <= 1/2x
where deltaT = (time series time interval)/numberSubreaches
Parameters:
numberSubreaches – integer specifying the number of routing subreaches.
muskingumK –floating-point number specifying the Muskingum "K" parameter, in hours.
muskingumX - floating-point number specifying the Muskingum "x" parameter, between 0.0 and 0.5 (inclusive).
Example:
warning = tsDataSet.isMuskingumRoutingStable(
reachCount,
kVal,
xVal)
if warning :
print warning
return
Returns: A string if the stability criteria is not met. The string contains a warning message detailing the specific instability problem. Otherwise returns None.
Generated Exceptions: Throws a hec.hecmath.HecMathException if the current time series is not a regular interval time series, or if values for numberSubreaches or muskingumX are invalid.
Last Valid Value's Date and Time
lastValidDate()
Find and return the date and time of the last valid (non-missing) value in a time series data set.
Parameters: Takes no parameters
Example: tsData.lastValidDate()
Returns: An integer value translatable by HecTime representing the date and time of the last valid time series value.
Last Valid Value in a Time Series
lastValidValue()
Find and return the last valid (non-missing) value in a time series data set.
Parameters: Takes no parameters
Example: tsData.lastValidValue()
Returns: A floating-point value representing the last valid time series value.
Natural Log, Base "e" Function
log()
Derive a new time series or paired data set from the natural log (log base "e") of values of the current data set. Missing values in the original data set remain missing. Values less than or equal to 0.0 will be set to missing.
For paired data sets, use the setCurve method to first select the paired data curve(s).
See also: log10(), setCurve()
Parameters: Takes no parameters
Example: newDataSet = dataSet.log()
Returns: A new HecMath object of the same type as the current object.
Log Base 10 Function
log10()
Derive a new time series or paired data set from the log base 10 of values of the current data set. Missing values in the original data set remain missing. Values less than or equal to 0.0 will be set to missing.
For paired data sets, use the setCurve method to first select the paired data curve(s).
See also: log(), setCurve()
Parameters: Takes no parameters
Example: newDataSet = dataSet.log10()
Returns: A new HecMath object of the same type as the current object.
Maximum Value in a Time Series
max()
Find and return the maximum value of the current time series data set. Missing values are ignored.
Parameters: Takes no parameters
Example: maxVal = tsData.max()
Returns: A floating-point value representing the maximum value of the current time series.
Maximum Value in a Time Series (tsMathArrary)
max(list of HecMath tsMathArray)
Determine the maximum of the current time series and the each time series in the parameter, tsMathArray. A new time series will be created which duplicates the time points of the current time series. Where time points match for the current and tsMathArray, the values will be the maximum of all time series for that time, provided the values for all time series are valid values (not missing). Points in the current time series which cannot be matched to valid points in tsMathArray are set to missing. Values in the current time series which are missing remain missing in the new time series.
The new time series will always have quality defined. For a specific time, if any of the quality values in the current or parameter time series is questionable or rejected, the quality value for that time in the new time series will be set to the most severe quality for that time (e.g. if questionable and rejected are both encountered, the new quality will be set to rejected.)
Parameters: tsMathArray the array of time series to be compared with the current time series.
Example: newDataSet = dataSet.max(list of HecMath tsMathArray)
Returns: a new time series representing the maximum values of all time series.
Maximum Value's Date and Time
maxDate()
Find and return the date and time of the maximum value for the current time series data set. Missing values are ignored.
Parameters: Takes no parameters
Example: maxDateTime = tsData.maxDate()
Returns: An integer value translatable by HecTime representing the date and time of the maximum time series value.
Mean Time Series Value
mean()
Compute the mean value of the current time series data set. Missing values are ignored.
Parameters: Takes no parameters
Example: meanVal = tsData.mean()
Returns: A floating-point value representing the mean value of the current time series.
Mean Time Series Value (tsMathArray)
mean(list of HecMath tsMathArray)
Determine the arithmetic mean of the current time series and the each time series in the parameter, tsMathArray. A new time series will be created which duplicates the time points of the current time series. Where time points match for the current and tsMathArray, the values will be the arithmetic mean of all time series for that time, provided the values for all time series are valid values (not missing). Points in the current time series which cannot be matched to valid points in tsMathArray are set to missing. Values in the current time series which are missing remain missing in the new time series.
The new time series will always have quality defined. For a specific time, if any of the quailty values in the current or parameter time series is questionable or rejected, the quality value for that time in the new time series will be set to the most severe quality for that time (e.g. if questionable and rejected are both encountered, the new quality will be set to rejected.)
Parameters: tsMathArray the array of time series to be compared with the current time series.
Example: newDataSet = dataSet.mean(list of HecMath tsMathArray)
Returns: a new time series representing the arithmetic mean of all time series.
Median Time Series Value
med(list of HecMath tsMathArray)
Determine the median (50th percentile) of the current time series and the each time series in the parameter, tsMathArray. A new time series will be created which duplicates the time points of the current time series. Where time points match for the current and tsMathArray, the values will be the median of all time series for that time, provided the values for all time series are valid values (not missing). Points in the current time series which cannot be matched to valid points in tsMathArray are set to missing. Values in the current time series which are missing remain missing in the new time series.
The new time series will always have quality defined. For a specific time, if any of the quailty values in the current or parameter time series is questionable or rejected, the quality value for that time in the new time series will be set to the most severe quality for that time (e.g. if questionable and rejected are both encountered, the new quality will be set to rejected.
Parameters: tsMathArray the array of time series to be compared with the current time series.
Example: newDataSet = dataSet.med(list of HecMath tsMathArray)
Returns: a new time series representing the median of all time series.
Merge Paired Data Sets
mergePairedData(PairedDataMath pdData)
Merge the current paired data set with the paired data set pdData. The resultant paired data set includes all the paired data curves from the current data set. Depending upon a previous use of the setCurveMethod on pdData, a single selected paired data curve or all curves from pdData are appended to the merged data set. The x-values for the two paired data sets must match exactly.
See also: setCurve()
Parameters: pdData - a paired data set with x-ordinates matching those of the current data set.
Example: mergedCurve = curve.mergePairedData(anotherCurve)
Returns: A new PairedDataMath object.
Merge Two Time Series Data Sets
mergeTimeSeries(TimeSeriesMath tsData)
Merge data from the current time series data set with the time series data set tsData. The resultant time series data set includes all the data points in the two time series, except where the data points occur at the same time. When data points from the two data sets are coincident in time, valid values in the current time series take precedence over valid values from tsData. However, if a coincident point is set to missing in the current time series data set, a valid value from tsData will be used for time in the resultant data set. If the values are missing for both data sets, the value is missing in the resultant data set.
The data sets for merging may have either regular or irregular time interval time series data. The data sets are tested to determine if they both have the same regular time interval. If not, the resultant data set is typed as an irregular interval data set.
Parameters: tsData - a time series data set for merging with the current time series data set.
Example: tsMerged = tsData.mergeTimeSeries(otherTsData)
Returns: A new TimeSeriesMath object.
Minimum Value in a Time Series
min()
Find and return the minimum value of the current a time series data set. Missing values are ignored.
Parameters: Takes no parameters
Example: minVal = tsData.min()
Returns: A floating-point value representing the minimum value of the current time series.
Minimum Value in a Time Series (tsMathArray)
min(list of HecMath tsMathArray)
Determine the minimum of the current time series and the each time series in the parameter, tsMathArray. A new time series will be created which duplicates the time points of the current time series. Where time points match for the current and tsMathArray, the values will be the minimum of all time series for that time, provided the values for all time series are valid values (not missing). Points in the current time series which cannot be matched to valid points in tsMathArray are set to missing. Values in the current time series which are missing remain missing in the new time series.
The new time series will always have quality defined. For a specific time, if any of the quailty values in the current or parameter time series is questionable or rejected, the quality value for that time in the new time series will be set to the most severe quality for that time (e.g. if questionable and rejected are both encountered, the new quality will be set to rejected.)
Parameters: tsMathArray the array of time series to be compared with the current time series.
Example: newDataSet = dataSet.min(list of HecMath tsMathArray)
Returns: a new time series representing the minimum values of all time series.
Minimum Value's Date and Time
minDate()
Find and return the date and time of the minimum value for the current time series data set. Missing values are ignored.
Parameters: Takes no parameters
Example: minDateTime = tsData.minDate()
Returns: An integer value translatable by HecTime representing the date and time of the minimum time series value.
Modified Puls or Working R&D Routing Function
modifiedPulsRouting(TimeSeriesMath tsFlow,
integer numberSubreaches,
floating-point muskingumX)
The current data set is a paired data set containing the storage-discharge table for Puls routing, where the x-values are storage and the y-values are discharge. The function derives a new time series data set from the Modified Puls or Working R&D routing of the time series data set tsFlow. numberSubreaches is the number of routing subreaches.
The Working R&D method provides a means of including the effects of inflow on reach storage by use of the Muskingum "x" wedge coefficient. The Working R&D method is activated in the computation if muskingumX is greater than 0.0. However, muskingumX cannot be greater that 0.5.
Parameters:
tsFlow – A regular interval time series data set for routing.
numberSubreaches – Number of routing subreaches.
muskingumX - Muskingum "X" parameter, between 0.0 and 0.5 (inclusive). Enter 0.0 to route by the Modified Puls method, or a value greater than 0.0 to apply the Working R&D.
Example:
routedFlow =
storDichareCurve.modifiedPulsRouting(
tsFlow,
reachCount,
coefficient)
Returns: A new TimeSeriesMath object.
Generated Exceptions: Throws a hec.hecmath.HecMathException if the tsMath is not a regular interval time series; if muskingumX is less than 0.0 or greater than 0.5; if the current paired data set does not have both ascending x and y values.
Modulo
modulo(floating-point constant)
Return the remainder of integer division of current time series by a constant.Times in which values are missing in the current time series remain missing in the new time series.
Parameters: constant the value to divide values in current time series.
Example: newDataSet = dataSet.modulo(floating-point constant)
Returns: a new time series resulting from the operation.
Modulo (tsMath)
modulo(HecMath tsMath)
Return the remainder of integer division of current time series by the parameter time series, tsMath. A new time series will be created which duplicates the time points of the current time series. Where time points match for the current time series and tsMath, the value in the current time series will be divided by the value in tsMath provided both values are valid (not missing). Divide by zeroes are not allowed. When the tsMath time series value is zero, the value for the new time series will be set to missing. Points in the current time series which cannot be matched to valid points in tsMath are set to missing. Values in the current time series which are missing remain missing in the new time series.
The new time series will always have quality defined. If a specific quality value in the parameter time series is questionable or rejected, that quality will be copied to the new time series.
Parameters: tsMath the time series to be divided into the current time series.
Example: newDataSet = dataSet.modulo(HecMath tsMath)
Returns: a new time series resulting from the operation.
Multiple Linear Regression Coefficients
multipleLinearRegression( sequence tsDataSequence,
floating-point minimumLimit,
floating-point maximumLimit)
Compute the multiple linear regression coefficients between the current time series data set and the array of independent time series data sets in tsDataSequence. The function stores the regression coefficients in a new paired data set. This paired data set may be used with the multipleLinearRegression function to derive a new estimated time series data set.
For the general linear regression equation, a dependent variable, Y, may be computed from a set independent variables, Xn:
Y = B0 + B1*X1 + B2*X2 + B3*X3
where Bn are linear regression coefficients.
For time series data sets, an estimate of the original time series data set values may be computed from a set of independent time series data sets using regression coefficients such that:
TsEstimate(t) = B0 + B1*TS1(t) + B2*TS2(t) + … + Bn*TSn(t)
where Bn are the set of regression coefficients and TSn are the time series data sets contained in tsDataSequence.
The parameters minimumLimit and maximumLimit may be used to exclude out of range values in the current time series data set from the regression determination. minimumLimit or maximumLimit may be entered as "Constants.UNDEFINED" to ignore the minimum or maximum value check.
See also: applyMultipleLinearRegression()
Parameters:
tsDataSequence – sequence of TimeSeriesMath objects, which form the independent variables in the regression equation. Must all be regular interval and have the same time interval.
minimumLimit – A floating-point value. Values in the current time series exceeding minimumLimit are excluded from the regression analysis. Set to Constants.UNDEFINED to ignore this option.
maximumLimit – A floating-point value. Values in the current time series exceeding maximumLimit are excluded from the regression analysis. Set to Constants.UNDEFINED to ignore this option.
Example:
regression = tsFlow.multipleLinearRegression (
[tsUpstrFlow1, tsUpstrFlow2, tsUpstrFlow3],
0.,
100000.)
Returns: A new PairedDataMath object containing the computed regression coefficients.
Generated Exceptions: Throws a hec.hecmath.HecMathException if the current data set and the data sets in tsDataSequence are not regular interval time series data sets with the same interval time.
Multiply by a Constant
multiply(floating-point constant)
Multiply the value constant to all valid values in the current time series or paired data set. For time series data, missing values are kept as missing. For paired data, constant multiplies the y-values only. Use the setCurveMethod to first select the paired data curve(s).
See also: multiply(TimeSeriesMath tsData); setCurve()
Parameters: constant - A floating-point precision value.
Example: newDataSet = dataSet.multiply(1.5)
Returns: A new HecMath object of the same type as the current object.
Multiply by a Data Set
multiply(TimeSeriesMath tsData)
Multiply valid values in the current data set by the corresponding values in the data set tsData. Both data sets must be time series data set.
When multiplying one time series data set to another, there is no restriction that times in the two data sets match exactly. However, only values with coincident times will be multiplied. Times in the current time series data set that cannot be matched with times in the second data set are set to missing. Values in the current data set that are missing are kept as missing. Either or both data sets may be regular or irregular interval time series.
See also: multiply(floating-point constant)
Parameters: tsData - A time series data set.
Example: newTsData = tsData.multiply(otherTsData)
Returns: A new TimeSeriesMath object.
Muskingum Hydrologic Routing Function
muskingumRouting(integer numberSubreaches,
floating-point muskingumK,
floating-point muskingumX)
Route the current regular interval time series data set by the Muskingum Routing method. The current data set must be a regular interval time series data set. muskingumK is the Muskingum "K" parameter, in hours, and muskingumX is the Muskingum "x" parameter. muskingumX cannot be less than 0.0 or greater than 0.5.
The set of Muskingum routing parameters may potentially produce numerical instabilities in the routed time series. Use the function isMuskingumRoutingStable() to test if the Muskingum routing parameters may potentially have instabilities.
See also: isMuskingumRoutingStable()
Parameters:
numberSubreaches – An integer specifying the number of routing subreaches.
muskingumK – A floating-point number specifying the Muskingum "K" parameter in hours.
muskingumX – A floating-point number specifying the Muskingum "x" parameter, between 0.0 and 0.5
Example:
routedFlows = tsFlows.muskingumRouting(reachCount, K, x)
Returns: A new TimeSeriesMath object.
Generated Exceptions: Throws a hec.hecmath.HecMathException if the current time series is not a regular interval time series; if muskingumX is less than 0.0 or greater than 0.5.
Negation Function
negative()
Derive a new time series composed of the negatives of the values of the current time series.Values which are missing in the original time series will be missing in the new time series.
Parameters: Takes no parameters
Example: newDataSet = dataSet.neg()
Returns: A new time series composed of the negatives of the values of the current time series.
Number of Invalid Values in a Time Series
numberInvalidValues()
Count and return the number of invalid values in the current time series data set.
Parameters: Takes no parameters
Example: invalidCount = tsData.numberInvalidValues()
Returns: An integer of the count of invalid (non-missing) time series values.
Number of Missing Values in a Time Series
numberMissingValues()
Count and return the number of missing values in the current time series data set.
Parameters: Takes no parameters
Example: missingCount = tsData.numberMissingValues()
Returns: An integer of the count of missing time series values.
Number of Questioned Values in a Time Series
numberQuestionedValues()
Count and return the number of questioned values in the current time series data set.
Parameters: Takes no parameters
Example: quiestionedCount = tsData.numberQuestionedValues()
Returns: An integer of the count of questioned (non-missing) time series values.
Number of Rejected Values in a Time Series
numberRejectedValues()
Count and return the number of rejected values in the current time series data set.
Parameters: Takes no parameters
Example: rejectedCount = tsData.numberRejectedValues()
Returns: An integer of the count of rejected (non-missing) time series values.
Number of Valid Values in a Time Series
numberValidValues()
Count and return the number of valid values in the current time series data set.
Parameters: Takes no parameters
Example: validCount = tsData.numberValidValues()
Returns: An integer of the count of valid (non-missing) time series values.
Olympic Smoothing
olympicSmoothing(integer numberToAverageOver,
boolean onlyValidValues,
boolean useReduced)
Derive a new time series from the Olympic smoothing of numberToAverageOver values in the current time series. numberToAverageOver must be and odd integer and greater than. Similar to centered moving average smoothing, except that the minimum and maximum values over the averaging interval are excluded from the computation.
If onlyValidValues is set to true, then if any values in the averaging interval are missing, the point in the resultant time series is set to missing. If onlyValidValues is set to false and there are missing values in the averaging interval, a smoothed point is still computed using the remaining valid values in the interval. If there are no valid values in the averaging interval, the point in the resultant time series is set to missing.
If useReduced is set to true, then moving average values can be still be computed at the beginning and end of the time series even if there are less than numberToAverageOver values in the interval. If useReduced is set to false, then the first and last numberToAverageOver/2 points of the resultant time series are set to missing.
Parameters:
numberToAverageOver – An integer specifying the number of values to average over for computing the smoothed time series. Must be an odd integer greater than two.
onlyValidValues – Either True or False, specifying whether all values in the averaging interval must be valid for the computed point in the resultant time series to be valid.
useReduced - Either True or False, specifying whether to allow points at the beginning and end of the smoothed time series to be computed from a reduced ( less than numberToAverageOver) number of values. Otherwise, set the first and last numberToAverageOver/2 points of the new time series to missing.
Example: avgData = tsData.olympicSmoothing(5, )
Returns: A new TimeSeriesMath object.
Generated Exceptions: Throws a HecMathException if the numberToAverageOver is less than three or not odd.
P1 Function
p1(list of HecMath tsMathArray)
Determine the first percentile of the current time series and the each time series in the parameter, tsMathArray. A new time series will be created which duplicates the time points of the current time series. Where time points match for the current and tsMathArray, the values will be the 1st percentile of all time series for that time, provided the values for all time series are valid values (not missing). Points in the current time series which cannot be matched to valid points in tsMathArray are set to missing. Values in the current time series which are missing remain missing in the new time series.
The new time series will always have quality defined. For a specific time, if any of the quailty values in the current or parameter time series is questionable or rejected, the quality value for that time in the new time series will be set to the most severe quality for that time (e.g. if questionable and rejected are both encountered, the new quality will be set to rejected.)
Parameters: tsMathArray the array of time series to be compared with the current time series.
Example: newDataSet = dataSet.p1(list of HecMath tsMathArray)
Returns: a new time series representing the first percentile of all time series.
P2 Function
p2(list of HecMath tsMathArray)
Determine the 2nd percentile of the current time series and the each time series in the parameter, tsMathArray. A new time series will be created which duplicates the time points of the current time series. Where time points match for the current and tsMathArray, the values will be the 2nd percentile of all time series for that time, provided the values for all time series are valid values (not missing). Points in the current time series which cannot be matched to valid points in tsMathArray are set to missing. Values in the current time series which are missing remain missing in the new time series.
The new time series will always have quality defined. For a specific time, if any of the quailty values in the current or parameter time series is questionable or rejected, the quality value for that time in the new time series will be set to the most severe quality for that time (e.g. if questionable and rejected are both encountered, the new quality will be set to rejected.)
Parameters: tsMathArray the array of time series to be compared with the current time series.
Examples: newDataSet = dataSet.p2(list of HecMath tsMathArray)
Returns: a new time series representing the 2nd percentile of all time series.
P5 Function
p5(list of HecMath tsMathArray)
Determine the fifth percentile of the current time series and the each time series in the parameter, tsMathArray. A new time series will be created which duplicates the time points of the current time series. Where time points match for the current and tsMathArray, the values will be the fifth percentile of all time series for that time, provided the values for all time series are valid values (not missing). Points in the current time series which cannot be matched to valid points in tsMathArray are set to missing. Values in the current time series which are missing remain missing in the new time series.
The new time series will always have quality defined. For a specific time, if any of the quailty values in the current or parameter time series is questionable or rejected, the quality value for that time in the new time series will be set to the most severe quality for that time (e.g. if questionable and rejected are both encountered, the new quality will be set to rejected.)
Parameters: tsMathArray the array of time series to be compared with the current time series.
Example: newDataSet = dataSet.p5(list of HecMath tsMathArray)
Returns: a new time series representing the fifth percentile of all time series.
P10 Function
p10(list of HecMath tsMathArray)
Determine the tenth percentile of the current time series and the each time series in the parameter, tsMathArray. A new time series will be created which duplicates the time points of the current time series. Where time points match for the current and tsMathArray, the values will be the tenth percentile of all time series for that time provided the values for all time series are valid values (not missing). Points in the current time series which cannot be matched to valid points in tsMathArray are set to missing. Values in the current time series which are missing remain missing in the new time series.
The new time series will always have quality defined. For a specific time, if any of the quality values in the current or parameter time series is questionable or rejected, the quality value for that time in the new time series will be set to the most severe quality for that time (e.g. if questionable and rejected are both encountered, the new quality will be set to rejected.)
Parameters: tsMathArray the array of time series to be compared with the current time series.
Example: newDataSet = dataSet.p10(list of HecMath tsMathArray)
Returns: a new time series representing the tenth percentile of all time series.
P20 Function
p20(list of HecMath tsMathArray)
Determine the 20th percentile of the current time series and the each time series in the parameter, tsMathArray. A new time series will be created which duplicates the time points of the current time series. Where time points match for the current and tsMathArray, the values will be the 20th percentile of all time series for that time, provided the values for all time series are valid values (not missing). Points in the current time series which cannot be matched to valid points in tsMathArray are set to missing. Values in the current time series which are missing remain missing in the new time series.
The new time series will always have quality defined. For a specific time, if any of the quailty values in the current or parameter time series is questionable or rejected, the quality value for that time in the new time series will be set to the most severe quality for that time (e.g. if questionable and rejected are both encountered, the new quality will be set to rejected.)
Parameters: tsMathArray the array of time series to be compared with the current time series.
Example: newDataSet = dataSet.p20(list of HecMath tsMathArray)
Returns: a new time series representing the 20th percentile of all time series.
P25 Function
p25(list of HecMath tsMathArray)
Determine the 25th percentile of the current time series and the each time series in the parameter, tsMathArray. A new time series will be created which duplicates the time points of the current time series. Where time points match for the current and tsMathArray, the values will be the 25th percentile of all time series for that time, provided the values for all time series are valid values (not missing). Points in the current time series which cannot be matched to valid points in tsMathArray are set to missing. Values in the current time series which are missing remain missing in the new time series.
The new time series will always have quality defined. For a specific time, if any of the quailty values in the current or parameter time series is questionable or rejected, the quality value for that time in the new time series will be set to the most severe quality for that time (e.g. if questionable and rejected are both encountered, the new quality will be set to rejected.)
Parameters: tsMathArray the array of time series to be compared with the current time series.
Example: newDataSet = dataSet.p25(list of HecMath tsMathArray)
Returns: a new time series representing the 25th percentile of all time series.
P75 Function
p75(list of HecMath tsMathArray)
Determine the 75th percentile of the current time series and the each time series in the parameter, tsMathArray. A new time series will be created
which duplicates the time points of the current time series. Where time points match for the current and tsMathArray, the values will be the 75th percentile of all time series for that time, provided the values for all time series are valid values (not missing). Points in the current time series which cannot be matched to valid points in tsMathArray are set to missing. Values in the current time series which are missing remain missing in the new time series.
The new time series will always have quality defined. For a specific time, if any of the quailty values in the current or parameter time series is questionable or rejected, the quality value for that time in the new time series will be set to the most severe quality for that time (e.g. if questionable and rejected are both encountered, the new quality will be set to rejected.)
Parameters: tsMathArray the array of time series to be compared with the current time series.
Example: newDataSet = dataSet.p75(list of HecMath tsMathArray)
Returns: a new time series representing the 75th percentile of all time series.
P80 Function
p80(list of HecMath tsMathArray)
Determine the 80th percentile of the current time series and the each time series in the parameter, tsMathArray. A new time series will be created which duplicates the time points of the current time series. Where time points match for the current and tsMathArray, the values will be the 80th percentile of all time series for that time, provided the values for all time series are valid values (not missing). Points in the current time series which cannot be matched to valid points in tsMathArray are set to missing. Values in the current time series which are missing remain missing in the new time series. The new time series will always have quality defined. For a specific time, if any of the quailty values in the current or parameter time series is questionable or rejected, the quality value for that time in the new time series will be set to the most severe quality for that time (e.g. if questionable and rejected are both encountered, the new quality will be set to rejected.)
Parameters: tsMathArray the array of time series to be compared with the current time series.
Example: newDataSet = dataSet.p80(list of HecMath tsMathArray)
Returns: a new time series representing the 80th percentile of all time series.
P89 Function
p89(list of HecMath tsMathArray)
Determine the 89th percentile of the current time series and the each time series in the parameter, tsMathArray. A new time series will be created which duplicates the time points of the current time series. Where time points match for the current and tsMathArray, the values will be the 89th percentile of all time series for that time, provided the values for all time series are valid values (not missing). Points in the current time series which cannot be matched to valid points in tsMathArray are set to missing. Values in the current time series which are missing remain missing in the new time series. The new time series will always have quality defined. For a specific time, if any of the quailty values in the current or parameter time series is questionable or rejected, the quality value for that time in the new time series will be set to the most severe quality for that time (e.g. if questionable and rejected are both encountered, the new quality will be set to rejected.)
Parameters: tsMathArray the array of time series to be compared with the current time series.
Example: newDataSet = dataSet.p89(list of HecMath tsMathArray)
Returns: a new time series representing the 89th percentile of all time series.
P90 Function
p90(list of HecMath tsMathArray)
Determine the 90th percentile of the current time series and the each time series in the parameter, tsMathArray. A new time series will be created which duplicates the time points of the current time series. Where time points match for the current and tsMathArray, the values will be the 90th percentile of all time series for that time, provided the values for all time series are valid values (not missing). Points in the current time series which cannot be matched to valid points in tsMathArray are set to missing. Values in the current time series which are missing remain missing in the new time series. The new time series will always have quality defined. For a specific time, if any of the quailty values in the current or parameter time series is questionable or rejected, the quality value for that time in the new time series will be set to the most severe quality for that time (e.g. if questionable and rejected are both encountered, the new quality will be set to rejected.)
Parameters: tsMathArray the array of time series to be compared with the current time series.
Example: newDataSet = dataSet.p90(list of HecMath tsMathArray)
Returns: a new time series representing the 90th percentile of all time series.
P95 Function
p95(list of HecMath tsMathArray)
Determine the 95th percentile of the current time series and the each time series in the parameter, tsMathArray. A new time series will be created which duplicates the time points of the current time series. Where time points match for the current and tsMathArray, the values will be the 95th percentile of all time series for that time, provided the values for all time series are valid values (not missing). Points in the current time series which cannot be matched to valid points in tsMathArray are set to missing. Values in the current time series which are missing remain missing in the new time series. The new time series will always have quality defined. For a specific time, if any of the quailty values in the current or parameter time series is questionable or rejected, the quality value for that time in the new time series will be set to the most severe quality for that time (e.g. if questionable and rejected are both encountered, the new quality will be set to rejected.)
Parameters: tsMathArray the array of time series to be compared with the current time series.
Example: newDataSet = dataSet.p95(list of HecMath tsMathArray)
Returns: a new time series representing the 95th percentile of all time series.
P99 Function
p99(list of HecMath tsMathArray)
Determine the 99th percentile of the current time series and the each time series in the parameter, tsMathArray. A new time series will be created which duplicates the time points of the current time series. Where time points match for the current and tsMathArray, the values will be the 99th percentile of all time series for that time, provided the values for all time series are valid values (not missing). Points in the current time series which cannot be matched to valid points in tsMathArray are set to missing. Values in the current time series which are missing remain missing in the new time series. The new time series will always have quality defined. For a specific time, if any of the quailty values in the current or parameter time series is questionable or rejected, the quality value for that time in the new time series will be set to the most severe quality for that time (e.g. if questionable and rejected are both encountered, the new quality will be set to rejected.)
Parameters: tsMathArray the array of time series to be compared with the current time series.
Example: newDataSet = dataSet.p99(list of HecMath tsMathArray)
Returns: a new time series representing the 99th percentile of all time series.
Period Constants Generation
periodConstants(TimeSeriesMath tsData)
Derive a new time series data set by applying values in the current time series data set to the times defined by the time series data set tsData. Both time series data sets may be regular or irregular interval. Values in a new time series are set according to:
ts1(j) ≤ tsnew![]() < ts1(j+1) , TSNEW
< ts1(j+1) , TSNEW![]() = TS1(j)
= TS1(j)
where ts1 is the time in the current time series, TS1 is the value in the current time series, tsnew is the time in the new time series, TSNEW is the value in the new time series.
If times in the new time series precede the first data point in the current time series, the value for these times is set to missing. If times in the new time series occur after the last data point in the current time series, the value for these times is set to the value of the last point in the current time series. The interpolation of values with the periodConstants function is shown below. 
Interpolation of Time Series Values Using Period Constants Function
Parameters: tsData - a regular or irregular interval time series data set.
Example: tsConstants = tsValues.periodConstants(tsData)
Returns: A new TimeSeriesMath object.
Polynomial Transformation
polynomialTransformation(TimeSeriesMath tsData)
Compute a polynomial transformation of a regular or irregular interval time series data set, tsData, using the polynomial coefficients stored in the current paired data set. Missing values in tsData remain missing in the resultant data set.
A new time series can be computed from an existing time series with the polynomial expression:
TS2 (t) = B1* TS1(t) + B2* TS1(t) 2 + ... + Bn* TS1(t) n
where Bn are the polynomial coefficients for term "n."
Values for the polynomial coefficients are stored in the x-values of the current paired data set. Before the above equation is applied, values in the input time series are adjusted by subtracting off the paired data "datum" value if defined. The units label and parameter type for the resultant time series are copied from the current paired data set x-units and parameter type.
See also: polynomialTransformationWithIntegral()
Parameters: tsData - a regular or irregular interval time series data set.
Example: tsXform = pdCoef.polynomialTransformation(tsData)
Returns: A new TimeSeriesMath object.
Polynomial Transformation with Integral
polynomialTransformationWithIntegral(TimeSeriesMath tsData)
Compute a polynomial transformation with integral of a regular or irregular interval time series data set, tsData, using the polynomial coefficients stored in the current paired data set. Missing values in tsData remain missing in the resultant data set.
This function is similar to the polynomialTranformation method, and the same set of polynomial coefficients is used. The equation for the polynomial transform is modified so that the transform of tsData is computed from the integral of the polynomial coefficients:
TS2 (t) = B1* TS1(t) 2/2 + B2*TS1(t)3/3+ ... + Bn* TS1(t) n+1/(n+1)
where Bn are the polynomial coefficients for term "n".
Values for the polynomial coefficients are stored in the x-values of the current paired data set. Before the above equation is applied, values in the input time series are adjusted by subtracting off the paired data "datum" value if defined. The units label and parameter type for the resultant time series are copied from the current paired data set x-units and parameter type.
See also: polynomialTransformation()
Parameters: tsData - a regular or irregular interval time series data set.
Example: tsXform = pdCoef.polynomialTransformationWith
Integral(tsData)
Returns: A new TimeSeriesMath object.
Product Function
product(list of HecMath tsMathArray)
Multiply the current time series with the each time series in the parameter, tsMathArray. A new time series will be created which duplicates the time points of the current time series. Where time points match for the current and tsMathArray, the values will be multiplied provided the values for all time series are valid values (not missing). Points in the current time series which cannot be matched to valid points in tsMathArray are set to missing. Values in the current time series which are missing remain missing in the new time series. The new time series will always have quality defined. For a specific time, if any of the quailty values in the current or parameter time series is questionable or rejected, the quality value for that time in the new time series will be set to the most severe quality for that time (e.g. if questionable and rejected are both encountered, the new quality will be set to rejected.)
Parameters: tsMathArray the array of time series to be multiplied with the current time series.
Example: newDataSet = dataset.product(list of HecMath tsMathArray)
Returns: a new time series representing the multiplication of the two time series
Rating Table Interpolation
ratingTableInterpolation(TimeSeriesMath tsData)
Transform/interpolate values in the time series data set tsData using the rating table x-y values stored in the current paired data set. For example, you can use the function to transform a time series of stage to a time series of flow using a stage-flow rating table. tsData may be a regular or irregular time interval data set. Missing values in tsData are kept missing in the resultant data set.
Create the paired data set with the rating table option to set values for "datum", "shift", and "offset". By default these values are 0.0. The shift is added to and the datum subtracted from all input time series values. If the rating table is Log-Log, the table x-values are adjusted by subtracting the offset.
Units and parameter type in resultant time series data set are defined by the y-units label and parameter type of the current paired data set. All other names and labels are copied over from tsData.
See also: reverseRatingTableInterpolation()
Parameters: tsData - a regular or irregular interval TimeSeriesMath object.
Example: tsFlow =
stageFlowCurve.ratingTableInterpolation(tsStage)
Returns: A new TimeSeriesMath object.
Replace Specific Values
replaceSpecificValues(HecDouble from, HecDouble to)
Replace specific values for another in the time series.
The function searches through the time series array and replaces values that match the "from" value with the "to" value. HecDouble controls the precision to which the value is compared (e.g., 12.345 is to three places after the decimal).
Parameters: from value which will be replaced to value with which to replace with
Examples: newDataSet = dataset.replaceSpecificValues
(HecDouble from, HecDouble to)
Returns: a copy of the current time series with the specific values replaced.
Reverse Rating Table Interpolation
reverseRatingTableInterpolation(TimeSeriesMath tsData)
Transform/interpolate values in the time series data set tsData using the reverse of the rating table stored in the current paired data set. For example, the function may be used to transform a time series of flow to a time series of stage using a stage-flow rating table. tsData may be a regular or irregular time interval data set. Missing values in tsData are kept missing in the resultant data set.
The paired data set should be created with the rating table option to set values for "datum", "shift", and "offset". By default, these values are 0.0. The shift is subtracted from, and the datum added to all input time series values. If the rating table is Log-Log, the table x-values are adjusted by subtracting the offset. Refer to the ratingTableInterpolation() description for comparison to this function.
Units and parameter type in resultant time series data set are defined by the x-units label and parameter type of the current paired data set. All other names and labels are copied over from the tsData.
See also: ratingTableInterpolation
Parameters: tsData - a regular or irregular interval TimeSeriesMath object.
Example: tsStage = stageFlowCurve.reverseRatingTable
Interpolation(tsFlow)
Returns: A new TimeSeriesMath object.
RMS Function
rms(list of HecMath tsMathArray)
Determine the root mean square (rms, or quadraticharmonic mean) of the current time series and the each time series in the parameter, tsMathArray. A new time series will be created which duplicates the time points of the current time series. Where time points match for the current and tsMathArray, the values will be the rms of all time series for that time, provided the values for all time series are valid values (not missing). Points in the current time series which cannot be matched to valid points in tsMathArray are set to missing. Values in the current time series which are missing remain missing in the new time series.
The new time series will always have quality defined. For a specific time, if any of the quailty values in the current or parameter time series is questionable or rejected, the quality value for that time in the new time series will be set to the most severe quality for that time (e.g. if questionable and rejected are both encountered, the new quality will be set to rejected.)
Parameters: tsMathArray the array of time series to be compared with the current time series.
Example: newDataSet = dataset.rms(list of HecMath tsMathArray)
Returns: a new time series representing the rms of all time series.
Round to Nearest Whole Number
round()
Rounds values in a time series or paired data set to the nearest whole number. The function rounds up the decimal portion of a number if equal to or greater than .5 and rounds down decimal values less than .5. For example:
10.5 is rounded to 11.
10.499 is rounded to 10.
The x-values in paired data sets are unaffected by the function, only the y-value data are rounded. For time series data sets, missing values are kept missing.
For paired data sets, use the setCurve() method to first select the paired data curve(s).
See also: roundOff(); truncate(); setCurve().
Parameters: Takes no parameters
Example: roundedData = dataSet.round()
Returns: A new HecMath object of the same type as the current object.
Round Off to Specified Precision
roundOff(integer significantDigits, integer powerOfTensPlace)
Round values in a time series or paired data set to a specified number of significant digits and/or power of tens place. For the power of tens place, -1 specifies rounding to one-tenth (0.1), while +2 rounds to the hundreds (100). For example:
1234.123456 will round to:
1230.0 for number of significant digits = 3, power of tens place = -1
1234.1 for number of significant digits = 6, power of tens place = -1
1234 for number of significant digits = 6, power of tens place = 0
1230 for number of significant digits = 6, power of tens place = 1
The x-values in paired data sets are unaffected by the function, only the y-value data are rounded. For time series data sets, missing values are kept missing.
For paired data sets, use the setCurve() method to first select the paired data curve(s).
See also: round(); truncate(); setCurve().
Parameters:
significantDigits – An integer specifying the number of significant digits to use in the rounding.
powerOfTensPlace – An integer specifying the power of tens place to use in the rounding.
Example: roundedData = dataSet.roundOff(5, -2)
Returns: A new HecMath object of the same type as the current object.
Screen for Erroneous Values Based on Constant Value
screenWithConstantValue(string duration,
floating-point rejectTolerance,
floating-point questionTolerance,
floating-point minThreshold,
integer maxMissing)
Flag values in time series whose values do not change more than a specified amount over a specified duation as questionable or rejected.
Values in the time series are screened for quality. All (non-missing) values whose difference over the specified duration is below rejectTolerance are marked with a rejected quality flag. Other values whose difference are over the specified duration is below questionTolerance are marked with a questioned quality flag. Other values are marked with an okay quality flag unless they are already marked as rejected or questioned. Only values above the specified minThreshold value are screened as described. Only time periods that contain no more that maxMissing missing values are screened as described.
Parameters:
tsc - The time series to derive from.
durationStr - The time period over which to perform the test, of the form nX, where in is an integer and X is one of Minutes, Hours, or Days, which can be abbreviated to one or more characters.
rejectTolerance - Values will be marked as rejected if they do not differ by more than this amount over the specified duration. To disable marking values as rejected, set this tolerance to less than zero.
questionTolerance - Values will be marked as questioned if they do not differ by more than this amount over the specified duration. To disable marking values as questioned, set this tolerance to less than zero.
minThreshold - Values will be screened only if they are greater than this value.
maxMissing - The maximum number of missing values to tolerate in the specified duration for screening purposes.
Example:
newDataSet = dataset.screenWithConstantValue(string duration,
floating-point rejectTolerance,
floating-point questionTolerance,
floating-point minThreshold,
integer maxMissing)
Returns: A copy of the time series with values with the quality set as described.
Screen for Erroneous Values Based on Duration Magnitude
screenWithDurationMagnitude(string durationStr,
floating-point minRejectLimit,
floating-point minQuestionLimit,
floating-point maxRejectLimit,
floating-point maxQuestionLimit)
Flag values in time series whose accumulation over a specified period lies minimum/maximum limits values as questionable or rejected.
Values in the time series are screened for quality. All (non-missing) values whose accumulated value for the specified duration is below minRejectLimit or above maxRejectLimit are marked with a rejected quality flag. Other values whose accumulated value for the specified duration is below minQuestionLimit or above maxQuestionLimit are marked with a questioned quality flag. Other values are marked with an okay quality flag unless they are already marked as rejected or questioned.
Parameters:
DurationStr - The time period over which to perform the test, of the form nX, where in is an integer and X is one of Minutes, Hours, or Days, which can be abbreviated to one or more characters.
minRejectLimit - Values whose accumulated value for the specified duration is below this will be marked as rejected.
minQuestionLimit - Values whose accumulated value for the specified duration is below this, but not below
minRejectLimit - will be marked as questioned.
maxQuestionLimit - Values whose accumulated value for the specified duration is above this, but not above
maxRejectLimit - will be marked as questioned.
maxRejectLimit - Values whose accumulated value for the specified duration is above this will be marked as rejected.
Example:
screenedData = tsData. screenWithDurationMagnitude(string durationStr,
floating-point minRejectLimit,
floating-point minQuestionLimit,
floating-point maxRejectLimit,
floating-point maxQuestionLimit)
Returns: A copy of the time series with values with the quality set as described.
Screen for Erroneous Values Based on Forward Moving Average
screenWithForwardMovingAverage(integer numberToAverageOver,
floating-point changeLimit)
Flag values in time series exceeding maximum change from a forward moving average. A running forward moving average of valid values is progressively computed over numberToAverageOver points. Values exceeding the moving average computed for the preceeding point location by more than changeLimit are flagged or set to the "Missing" value depending upon the settings for setInvalidToMissingValue or qualityFlagForInvalidValue parameters. Values failing the quality test are excluded from the forward moving average computation for the subsequent points. The maximum change comparison is done only when consecutive values are not flagged.
Parameters:
numberToAverageOver - the number of values to average over for computing the forward moving average. Must be greater than two.
changeLimit - allowed deviation in the tested value from the forward moving average.
Example:
screenedData = tsData.screenWithForwardMovingAverage(
integer numberToAverageOver, floating-point changeLimit)
Returns: a copy of the time series with values failing the quality test set to undefined and with the quality flag set to missing.
Screen for Erroneous Values Based on Forward Moving Average (Missing Values)
screenWithForwardMovingAverage(integer numberToAverageOver,
floating-point changeLimit,
boolean setInvalidToMissingValue,
string qualityFlagForInvalidValue)
Screen the current time series data set for possible erroneous values based on the deviation from the forward moving average over numberToAverageOver values computed at the previous point. If the deviation from the moving average is greater than changeLimit, the value fails the screening test. Data values failing the screening test are assigned a quality flag and/or are set to missing.
Missing values and values failing the screening test are not counted in the moving average and the divisor of the average is less one for each such value. At least two values must be defined in the moving average else the moving average is undefined and value being examined is screened acceptable.
If setInvalidToMissingValue is true, values failing the screening test are set to missing.
If qualityFlagForInvalidValue is set to a character or string recognized as a valid quality flag, the quality flag will be set for tested values. If there is no previously existing quality available for the time series, the quality flag array will be created for the time series. Values failing the quality test are set to the user specified quality flag for invalid values. If there is existing quality data and the time series value passes the quality test, the existing quality flag for the points is unchanged. If there was no previously existing quality and the time series value passes the quality test, the quality flag for the point is set to "Okay".
The acceptable values for qualityFlagForInvalidValue strings are: "M" or "Missing", "R" or "Rejected", "Q" or "Questionable". A blank string (" ") is entered to disable the setting of the quality flag.
For the example:
resultantDataSet = dataSet.screenWithForwardMovingAverage (16, 100., TRUE, "R")
the forward moving average will be computed over 16 values, values deviating from the moving average by more than 100.0 will be set to missing and flagged as rejected.
Parameters:
numberToAverageOver – An integer specifying the number of averaging values. Must be at least two.
changeLimit – A floating-point number specifying the maximum change allowed in the tested value from the forward moving average value.
setInvalidToMissingValue – Either True or False, specifying whether time series values failing the screening test are set to the "Missing" value.
qualityFlagForInvalidValue - A string representing the quality flag setting for values failing the screening test. The accepted character strings are: "M" or "Missing", "R" or "Rejected", "Q" or "Questionable". An empty string (" ") is entered to disable the setting of the quality flag.
Example:
screenedData = tsData.screenWithForwardMovingAverage
(16, 100., TRUE, "R")
Returns: A new TimeSeriesMath object.
Generated Exceptions: Throws a HecMathException if numberToAverageOver is less than two; if an unrecognized quality flag is entered for qualityFlagForInvalidValue or if setInvalidToMissing
Value is false and qualityFlagForInvalidValue is blank (no action would occur).
Screen for Erroneous Values Based on Maximum/Minimum Range (Missing Values)
screenWithMaxMin(floating-point minValueLimit,
floating-point maxValueLimit,
floating-point changeLimit,
boolean setInvalidToMissingValue,
string qualityFlagForInvalidValue)
Flag values in a time series data set exceeding minimum and maximum limit values or maximum change limit.
Values in the time series are screened for quality. Values below minValueLimit or above maxValueLimit or with a change from the previous time series value greater than changeLimit fail the screening test. The maximum change comparison is done only when consecutive values are not flagged.
If setInvalidToMissingValue is set to true, values failing the screening test are set to the "Missing" value.
If qualityFlagForInvalidValue is set to a character or string recognized as a valid quality flag, the quality flag will be set for tested values. If there is no previously existing quality available for the time series, the quality flag array will be created for the time series. Values failing the quality test are set to the user specified quality flag for invalid values. If there is existing quality data and the time series value passes the quality test, the existing quality flag for the points is unchanged. If there was no previously existing quality and the time series value passes the quality test, the quality flag is set to "Okay".
For example:
resultantDataSet = dataSet.screenWithMaxMin (0.0, 1000., 100., FALSE, "R")
time series values less than 0.0, or greater than 1000., or with a change from a previous point greater than 100 will be flagged as "Rejected". Flagged points however will not be set to the "Missing" value.
Parameters:
minValueLimit – A floating-point number specifying the minimum valid value limit.
maxValueLimit - A floating-point number specifying the maximum valid value limit.
changeLimit - A floating-point number specifying the maximum change allowed in the tested value from the previous time series value.
setInvalidToMissingValue - Either True, or False, specifying whether time series values failing the screening test are set to the "Missing" value.
qualityFlagForInvalidValue - A string representing the quality flag setting for values failing the screening test. The accepted character strings are: "M" or "Missing", "R" or "Rejected", "Q" or "Questionable". An empty string (" ") is entered to disable the setting of the quality flag.
Example:
screenedData = tsData.screenWithMaxMin(0., 1000., 100., FALSE, "R")
Returns: A new TimeSeriesMath object.
Generated Exceptions: Throws a HecMathException if an unrecognized quality flag is entered for qualityFlagForInvalidValue or if setInvalidToMissingValue is false and qualityFlagForInvalidValue is blank (no action would occur).
Screen for Erroneous Values Based on Maximum/Minimum Range
screenWithMaxMin(floating-point minValueLimit,
floating-point maxValueLimit,
floating-point changeLimit)
Flag values in time series exceeding minimum and maximum limit values or maximum change limit.
Values in the time series are screened for quality. Values below minValueLimit or above maxValueLimit or with a change from the previous time series value greater than changeLimit fail the quality test. The maximum change comparison is done only when consecutive values are not flagged.
Values failing the screening test are set to the "Missing" value.
Parameters:
minValueLimit - minimum valid value limit.
maxValueLimit - maximum valid value limit.
changeLimit - maximum change allowed in the tested value from the previous time series value.
Example: screenedData = screenWithMaxMin(floating-point minValueLimit, floating-point maxValueLimit, floating-point changeLimit)
Returns: a copy of the time series with values failing the quality test set to missing.
Screen for Erroneous Values Based on Maximum/Minimum Range (Quality)
screenWithMaxMin(floating-point minValueLimit,
floating-point maxValueLimit,
floating-point changeLimit,
boolean setInvalidToMissingValue,
floating-point invalidValueReplacement,
string qualityFlagForInvalidValue)
Flag values in time series exceeding minimum and maximum limit values or maximum change limit.
Values in the time series are screened for quality. Values below minValueLimit or above maxValueLimit or with a change from the previous time series value greater than changeLimit fail the quality test. The maximum change comparison is done only when consecutive values are not flagged.
Parameters:
minValueLimit - minimum valid value limit.
maxValueLimit - maximum valid value limit.
changeLimit - maximum change allowed in the tested value from the previous time series value.
setInvalidValueToSpecified - if true, time series values failing the quality test are set to the specified value.
invalidValueReplacement - The value to use for replacing invalid values is setInvalidToSpecifiedValue is set to "true".
qualityFlagForInvalidValue - character string representing the quality flag setting for values failing the quality test. The accepted character strings are: "M" or "Missing", "R" or "Rejected", "Q" or "Questionable".
Example: screenedData = tsData.screenWithMaxMin(floating-point minValueLimit, floating-point maxValueLimit,
floating-point changeLimit,
boolean setInvalidToMissingValue,
floating-point invalidValueReplacement,
string qualityFlagForInvalidValue)
Returns: a copy of the time series with values failing the quality test set to missing.
Screen for Erroneous Values Based on Maximum/Minimum Range (Limits)
screenWithMaxMin(floating-point minRejectLimit,
floating-point minQuestionLimit,
floating-point maxQuestionLimit,
floating-point maxRejectLimit)
Flag values in time series exceeding minimum and maximum limit values as questionable or rejected. Values in the time series are screened for quality. Values below minRejectLimit or above maxRejectLimit are marked with a rejected quality flag. Other values below minQuestionLimit or above maxQuestionLimit are marked with a questioned quality flag. Other values are marked with an okay quality flag unless they are already marked as rejected or questioned.
Parameters:
minRejectLimit - Values below this will be marked as rejected.
minQuestionLimit - Values below this, but not below minRejectLimit will be marked as questioned.
maxQuestionLimit - Values above this, but not above maxRejectLimit will be marked as questioned.
maxRejectLimit - Values above this will be marked as rejected.
Example: screenedData = tsData.screenWithMaxMin(floating-point minRejectLimit,
floating-point minQuestionLimit,
floating-point maxQuestionLimit,
floating-point maxRejectLimit)
Returns: A copy of the time series with values with the quality set as described.
Screen for Erroneous Values Based on Rate of Change
screenWithRateOfChange(floating-point minRejectLimit,
floating-point minQuestionLimit,
floating-point maxQuestionLimit,
floating-point maxRejectLimit)
Flag values in time series whose rate of change from the last valid value exceed minimum/maximum limits values as questionable or rejected.
Values in the time series are screened for quality. Values whose rate of change from the last valid value is below minRejectLimit or above maxRejectLimit are marked with a rejected quality flag. Other whose rates of change from the last valid value are values below minQuestionLimit or above maxQuestionLimit is marked with a questioned quality flag. Other values are marked with an okay quality flag unless they are already marked as rejected or questioned.
Rates are computed in units per hour.
Parameters:
minRejectLimit - Values whose rate of change from the last valid value are below this will be marked as rejected.
minQuestionLimit - Values whose rate of change from the last valid value are below this, but not below
minRejectLimit - will be marked as questioned.
maxQuestionLimit - Values whose rate of change from the last valid value are above this, but not above maxRejectLimit will be marked as questioned.
maxRejectLimit - Values whose rate of change from the last valid value are above this will be marked as rejected.
Example: newDataSet = dataset.screenWithRateOfChange(
floating-point minRejectLimit,
floating-point minQuestionLimit,
floating-point maxQuestionLimit,
floating-point maxRejectLimit)
Returns: A copy of the time series with values with the quality set as described.
Select a Paired Data Curve by Curve Label
setCurve(string curveName)
Select, by curve label, the paired data curve for performing subsequent arithmetic operations or math functions. By default, a paired data set loaded from file has all curves selected.
A paired data set may contain more than one set of y-values. However, a user may wish to modify only one curve of the data set. For example, using the function ".add( 2.0 )" would by default add 2.0 to all y-values for all curves. The setCurve() call may be used to limit the operation to just one selected set of y-values. The function searches the paired data set list of curve labels for a match to curveName. If a match is found, that curve is set as the selected curve.
See also: setCurve( integer curveNumber )
Example: damageCurve.setCurve("RESIDENTIAL")
Parameters: curveName – The curve label (a string) to set as the selected curve.
Returns: Nothing
Generated Exceptions: Throws a HecMathException – if curveName is not found in the paired data set curve labels.
Select a Paired Data Curve by Curve Number
setCurve(integer curveNumber)
Select, by curve number, the paired data curve for performing subsequent arithmetic operations or math functions. By default, a paired data set loaded from file has all curves selected.
A paired data set may contain more than one set of y-values. However, a user may wish to modify only one curve of the data set. For example, using the function ".add( 2.0 )" would by default add 2.0 to all y-values for all curves. The setCurve() call can be used to limit the operation to just one selected set of y-values. The function sets a curve index internal to the paired data set. The option is to select one curve or all curves.
Curve numbering begins with "0". If a paired data set has two curves, the first curve is selected by, "setCurve(0)". To select the second curve, use "setCurve(1)".
All curves in a paired data set are selected by setting curveNumber to -1.
See also: setCurve( String curveName)
Parameters: curveNumber – An integer specifying the curve to set as the selected curve. Curve numbering begins with 0. Set to –1 to select all curves.
Example: ruleCurve.setCurve(-1)
Returns: Nothing
Set Data Container
setData(hec.io.DataContainer container)
Sets the data container for the current data set. For time series data sets, this is a hec.io.TimeSeriesContainer. For paired data sets, container should be a hec.io.PairedDataContainer. Containers are generated by some of the other functions.
The hec.io.DataContainer class and the hec.io.TimeSeriesContainer and the hec.io.PairedDataContainer subclasses contain the time series and paired data values.
Parameters: container – A hec.io.TimeSeriesContainer for time series data sets, or a hec.io.PairedDataContainer for paired data sets.
Example: dataSet.setData(TSContainer)
Returns: Nothing
Generated Exceptions: Throws a HecMathException if container is not of type hec.io.TimeSeriesContainer for time series data sets or not of type hec.io.PairedDataContainer for paired data sets.
Set Location Name for Data Set
setLocation(String locationName)
Set the location name for a data set, which changes the B-Part of the HEC-DSS pathname. The new pathname will be used in plots, tables, and in the write() method of DSSFile objects.
Parameters: locationName – A string specifying the new location name for the data set.
Example: dataSet.setLocation("OAKVILLE")
Returns: Nothing
Set Parameter for Data Set
setParameterPart(String parameterName)
Set the parameter name for a data set, which changes the C-Part of the HEC-DSS pathname. The new pathname will be used in plots, tables, and in the write() method of DSSFile objects.
Parameters: parameterName – A string specifying the new parameter name for the data set.
Example: dataSet.setParameterPart("ELEV")
Returns: Nothing
Set Pathname for Data Set
setPathname(String pathname)
Set the pathname for a data set to the specified pathname. Subsequent operations using the data set such as getData() or DSSFile.write() will use or reflect the new pathname.
Parameters: pathname – A string specifying the new pathname for the data set.
Example: dataSet.setPathname("//OAKVILLE/STAGE//1HOUR/OBS/")
Returns: Nothing
Set Time Interval for Data Set
setTimeInterval(String interval)
Set the time interval for a data set, which changes the E-Part of the pathname. The new pathname will be used in plots, tables, and in the write() method of DSSFile objects.
Parameters: interval – A string specifying the new interval for the data set.
Example: dataSet.setTimeInterval("1HOUR")
Returns: Nothing
Set Data Type for Time Series Data Set
setType(string typeString)
Set the data for a time series data set.
Parameters: typeString – A string specifying the data type for the data set. This should be "INST-CUM", "INST-VAL", "PER-AVER" or "PER-CUM"
Example: dataSet.setType("PER-AVER")
Returns: Nothing
Set Units Label for Data Set
setUnits(String unitsString)
Set the units label for a data set. For a paired data set, the call sets the y-units label.
Parameters: unitsString – A string specifying the units label for the data set.
Example: dataSet.setUnits("CFS")
Returns: Nothing
Set Version Name for Data Set
setVersion(String versionName)
Set the version name for a data set, which changes the F-Part of the pathname. The new pathname will be used in plots, tables, and in the write() method of DSSFile objects.
Parameters: version – A string specifying the new location for the data set.
Example: dataSet.setVersion("OBSERVED")
Returns: Nothing
Set Watershed Name for Data Set
setWatershed(String watershedName)
Set the watershed (or river) name for a data set, which changes the A-Part of the pathname. The new pathname will be used in plots, tables, and in the write() method of DSSFile objects.
Parameters: watershedName – A string specifying the new watershed name for the data set.
Example: dataSet.setWatershed("OAK RIVER")
Returns: Nothing.
Shift Adjustment of Time Series Data
shiftAdjustment(TimeSeriesMath tsData)
Derive a new time series data set by linear interpolation of values in the current time series data set at the times defined by the time series data set tsData. If times in the new time series precede the first data point in the current time series, the value for these times is set to 0.0. If times in the new time series occur after the last data point in the current time series, the value for these times is set to the value of the last point in the current time series. Interpolation of values with the shiftAdjustment function is shown below. 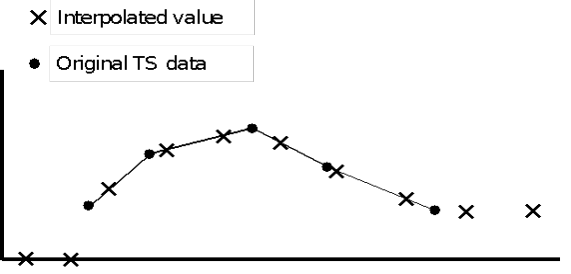
Interpolation of Time Series Values using Shift Adjustment Function
Both time series data sets may be regular or irregular interval. Interpolated points must be bracketed or coincident with valid (not missing) values in the original time series; otherwise the values are set as missing.
Parameters: tsData – A regular or irregular interval time series data set.
Example: tsInterp = tsValues.shiftAdjustment(tsData)
Returns: A new TimeSeriesMath object.
Shift Time Series in Time
shiftInTime(string timeShiftString)
Shift the times in the current time series data set by the amount specified with timeShiftString. The data set may be regular or irregular interval time series data. Data set values are unchanged.
timeShiftString has the form "nT", where "n" is an integer number and "T" is "M"(inute), "H"(our), "D"(ay), "W"(eek), "Mo"(nth),or "Y"(ear). Only the first character is significant for "T", except for "Month", which requires at least two characters.
Parameters: timeShiftString – A string specifying the time increment to shift times in the current time series data set.
Example: TsShifted = tsData.shiftInTime("3H")
Returns: A new TimeSeriesMath object.
Sign Function
sign()
Derive a new time series composed of the signs of the values of the current time series. Values which are missing in the original time series will be missing in the new time series. Values in the current time series will be represented as -1.0, 0.0 or 1.0 in the derived time series, depending on whether the original value is < 0.0, 0.0 or > 0.0.
Parameters: Takes no Parameters
Example: newDataSet = dataSet.sign()
Returns: A new time series composed of the negatives of the values of the current time series
Sine Trigonometric Function
sin()
Derive a new time series or paired data set from the sine of values of the current data set. The resultant data set values are in radians. For time series data, missing values are kept as missing.
For paired data sets, use the setCurveMethod to first select the paired data curve(s).
See also: setCurve()
Parameters: Takes no parameters
Example: newDataSet = dataSet.sin()
Returns: A new HecMath object of the same type as the current object
Skew Coefficient
skewCoefficient()
Compute the skew coefficient of the current time series data set. Missing values are ignored.
Parameters: Takes no parameters
Example: skewCoefficient = dataSet.skewCoefficient()
Returns: A floating-point value representing the skew coefficient of the current time series.
Snap Irregular Times to Nearest Regular Period
snapToRegularInterval(string timeIntervalString,
string timeOffsetString,
string timeBackwardString,
string timeForwardString)
"Snap" data from the current irregular or regular interval time series to form a new regular interval time series of the specified interval and offset. For example, a time series record from a gauge recorder collects readings 6 minutes past the hour. The function may be used to "snap" or shift the time points to the top of the hour.
The regular interval time of the resultant time series is specified by timeIntervalString. timeIntervalString is a valid HEC time increment string (e.g. "1MIN", "15MIN", "1HOUR", "6HOUR", "1DAY", "1MONTH").
Times in the resultant time series may be shifted (offset) from the regular interval time by the increment specified by timeOffsetString. As an example, the offset could be used to shift times from the top of the hour to instead six minutes past the hour. Data from the original time series is "snapped" to the regular interval if the time of the data falls within the time window set by the timeBackwardString and the timeForwardString. That is, if the new regular interval is at the top of the hour and the time window extends to nine minutes before the hour and fifteen minutes after the hour, an original data point at 0852 would be snapped to the time 0900 while a point at 0916 would be ignored.
timeOffsetString, timeBackwardString and timeForwardString are time increment strings expressed as "nT", where "n" is an integer number and "T" is one of the time increments: "M(INUTES)", "D(AYS)" or "H(OUR)" (characters in the parenthesis are optional). For the example of the previous paragraph, timeIntervalString would be "1HOUR", timeOffsetString would be "0M", timeBackwardString would be "9M" (or "9min") and timeForwardString would be "15M." A blank string (" ") is equivalent to "0M".
By default values in the resultant regular interval time series data set are set to missing unless matched to times in the current time series data set within the time window tolerance set by timeBackwardString and timeForwardString.
Parameters:
timeIntervalString – A string specifying the regular time interval for the resultant time series.
timeOffsetString – A string specifying the offset of the new time points from the regular interval time. This variable may be an empty string (" ") or None.
timeBackwardString – A string specifying the time to look backwards from the regular time interval for valid time points.
timeForwardString – A string specifying the time to look forward from the regular time interval for valid time points.
Example: rtsData = itsData.snapToRegularInterval("1HOUR", None, "5Min", "5Min")
Returns: A new regular interval TimeSeriesMath object.
Square Root
sqrt()
Derive a new time series or paired data set computed from the square root of values of the current data set. For time series data, missing values are kept as missing. Values less than zero are set to missing.
For paired data sets, use setCurve to first select the paired data curve(s).
See also: setCurve()
Parameters: Takes no parameters
Example: newDataSet = dataSet.sqrt()
Returns: A new HecMath object of the same type as the current object.
Standard Deviation of Time Series
standardDeviation()
Compute the standard deviation value of the current time series data set. Missing values are ignored.
Parameters: Takes no parameters
Example: stdDev = tsData.standardDeviation()
Returns: A floating-point value representing the standard deviation of the current time series
Standard Deviation of Time Series (tsMathArray)
standardDeviation(list of HecMath tsMathArray)
Determine the standard deviation of the current time series and the each time series in the parameter, tsMathArray. A new time series will be created which duplicates the time points of the current time series. Where time points match for the current and tsMathArray, the values will be the standard deviation of all time series for that time, provided the values for all time series are valid values (not missing). Points in the current time series which cannot be matched to valid points in tsMathArray are set to missing. Values in the current time series which are missing remain missing in the new time series.
The new time series will always have quality defined. For a specific time, if any of the quailty values in the current or parameter time series is questionable or rejected, the quality value for that time in the new time series will be set to the most severe quality for that time (e.g. if questionable and rejected are both encountered, the new quality will be set to rejected.)
Parameters: tsMathArray - the array of time series to be compared with the current time series.
Example: stdDev = tsData.standardDeviation(list of HecMath tsMathArray)
Returns: a new time series representing the standard deviation of all time series.
Straddle Stagger Hydrologic Routing
straddleStaggerRouting(integer numberToAverage,
integer numberToLag,
integer numberSubreaches)
Route the current regular interval time series data set using the Straddle-Stagger hydrologic routing method. numberToAverage specifies the number of ordinates to average over (Straddle). numberToLag specifies the number ordinates to lag (Stagger). The number of routing subreaches is set by numberSubreaches.
Parameters:
numberToAverage – An integer specifying the number of ordinates to average over (Straddle).
numberToLag – An integer specifying the number of ordinates to lag (Stagger).
numberSubreaches – An integer specifying the number of routing subreaches.
Example: tsRouted = tsFlow.straddleStaggerRouting
(numberAver, lag, reachCount)
Returns: A new TimeSeriesMath object.
Subtract a Constant
subtract(floating-point constant)
Subtract the value constant from all valid values in the current time series or paired data set. For time series data, missing values are kept as missing.
For paired data, constant is subtracted from y-values only. Use the setCurve method to first select the paired data curve(s).
See also: subtract(HecMath hecMath); setCurve()
Parameters: constant - A floating-point value.
Example: newDataSet = dataSet.subtract(5.3)
Returns: A new HecMath object of the same type as the current object.
Subtract a Data Set
subtract(TimeSeriesMath tsData)
Subtract the values in the data set tsData from the values in the current data set. Both data sets must be time series data set.
When subtracting one time series data set from another, there is no restriction that times in the two data sets match exactly. However, only values with coincident times will be subtracted. Times in the current time series data set that cannot be matched with times in the second data set are set missing. Values in the current data set that are missing are kept as missing. Either or both data sets may be regular or irregular interval time series.
See also: subtract(floating-point constant)
Parameters: tsData - a TimeSeriesMath object.
Example: newDataSet = dataSet.subtract(otherDataSet)
Returns: A new TimeSeriesMath object.
Successive Differences for Time Series
successiveDifferences()
Derive a new time series from the difference between successive values in the current regular or irregular interval time series data set. The current data must be of type "INST-VAL" or "INST-CUM". A value in the resultant time series is set to missing if either the current or previous value in the current time series is missing (need to have two consecutive valid values). If the data type of the current data set is "INST-CUM" the resultant time series data set is assigned the type "PER-CUM", otherwise the data type does not change.
See also: timeDirivative()
Parameters: Takes no parameters
Example: newTsData = tsData.successiveDifferences()
Returns: A new TimeSeriesMath object.
Generated Exceptions: Throws a HecMathException if the current data set is not of type "INST-VAL" or "INST-CUM".
Sum Values in Time Series
sum()
Sum the values of the current time series data set. Missing values are ignored.
Parameters: Takes no parameters
Example: total = tsData.sum()
Returns: A floating-point value representing the sum of all valid values of the current time series.
Sum Values in Time Series (tsMathArray)
sum(list of HecMath tsMathArray)
Add each of the time series in the parameter, tsMathArray, to the current time series. A new time series will be created which duplicates the time points of the current time series. Where time points match for the current time series and each time series in tsMathArray, the values will be summed provided values for all time series are valid values (not missing). Points in the current time series which cannot be matched to valid points in tsMathArray are set to missing. Values in the current time series which are missing remain missing in the new time series.
The new time series will always have quality defined. For a specific time, if any of the quality values in the current or parameter time series is questionable or rejected, the quality value for that time in the new time series will be set to the most severe quality for that time (e.g. if questionable and rejected are both encountered, the new quality will be set to rejected.)
Parameters: tsMathArray - the array of time series to be added to the current time series.
Example: tsData.sum(list of HecMath tsMathArray)
Returns: a new time series representing the sum of the two time series
Tangent Trigonometric Function
tan()
Derive a time series or paired data set computed from the tangent of values of the current data set. For time series data, missing values are kept as missing. If the cosine of the current time series value is zero, the value is set missing.
For paired data sets, use the setCurve method to first select the curve(s).
See also: setCurve()
Example: newDataSet = dataSet.tan()
Parameters: Takes no parameters
Returns: A new HecMath object of the same type as the current object.
Time Derivative (Difference per Unit Time)
timeDerivative()
Derive a new time series data set from the successive differences per unit time of the current regular or irregular interval time series data set. For the time "t",
TS2(t) = ( TS1(t) – TS1(t-1) ) / DT
where DT is the time difference between t and t-1. For the current form of the function, the units of DT are minutes.
A value in the resultant time series is set to missing if either the current or previous value in the original time series is missing (need to have two consecutive valid values). By default, the data type of the resultant time series data set is assigned as "PER-AVER".
See also: successiveDifferences()
Parameters: Takes no parameters
Example: newTsData = tsData.timeDerivative()
Returns: A new TimeSeriesMath object
Transform Time Series to Regular Interval
transformTimeSeries(string timeIntervalString,
string timeOffsetString,
string functionTypeString)
Generate a new regular interval time series data set from the current regular or irregular time series. The new time series is computed having the regular time interval specified by timeIntervalString and time offset set by timeOffsetString.
Values for the new time series are computed from the original time series data set using one of seven available functions. The function is selected by setting functionTypeString to one of the following types:
"INT"- Interpolate at end of interval
"MAX"- Maximum over interval
"MIN"- Minimum over interval
"AVE"- Average over interval
"ACC"- Accumulation over interval
"ITG"- Integration over interval
"NUM"- Number of valid data over interval
where "interval" is the interval between time points in the new time series.
The regular interval time of the new time series is specified by timeIntervalString. timeIntervalString is a valid HEC time increment string (e.g. ""1MIN", "15MIN", "1HOUR", "6HOUR", "1DAY", "1MONTH").
Times in the resultant time series may be shifted (offset) from the regular interval time by the increment specified by timeOffsetString. As an example, the offset could be used to shift times from the top of the hour to six minutes past the hour. Typically no offset is used.
The data type of the original time series data governs how values are interpolated. Data type "INST-VAL" (or "INST-CUM") considers the value to change linearly over the interval from the previous data value to the current data value. Data type "PER-AVER" considers the value to be constant at the current data value over the interval. Data type "PER-CUM" considers the value to increase from 0.0 (at the start of the interval) up to the current value over the interval. Interpolation of the three data types is illustrated below.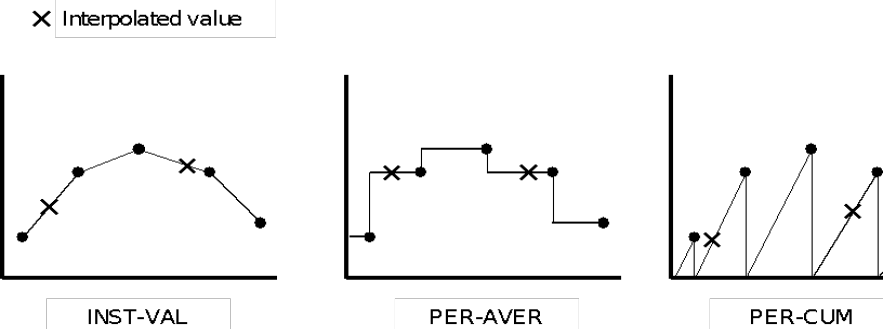
Interpolation of "INST-VAL", "PER-AVER" and "PER-CUM" Data
How interpolation is performed for a specific data type influences the computation of new time series values for the selected function. For example, if the data type is "INST-VAL", the function "Maximum over interval" is evaluated by: Finding the maximum value of the data points from the original time series that are inclusive in the new time interval. Linearly interpolate values at beginning and ending of the new time interval, and determine if these values represent the maximum over the interval.
Referring to the plots above, the "Average over interval" function is applied to a time series by integrating the area under the curve between interpolated points and dividing the result by the interval time.
See also: transformTimeSeries( TimeSeriesMath tsData, string functionTypeString)
Parameters:
timeIntervalString – A string specifying the regular time interval for the resultant time series.
timeOffsetString – A string specifying the offset of the new time points from the regular interval time. This variable may be a blank string (" ").
functionTypeString – A string specifying the method for computing values for the new time series data set.
Example: newTsData = tsData.transformTimeSeries("1Day", "0M", "AVE")
Returns: A new regular interval TimeSeriesMath object.
Transform Time Series to Irregular Interval
transformTimeSeries(TimeSeriesMath tsData,string functionTypeString)
Generate a new time series data set from the current regular or irregular time series. The times for the new data set are defined by the times in tsData, which may be a regular or irregular time series data set.
Values for the new time series are computed from the original time series data set using one of seven available functions. The function is selected by setting functionTypeString to one of the following types:
"INT"- Interpolate at end of interval
"MAX"- Maximum over interval
"MIN"- Minimum over interval
"AVE"- Average over interval
"ACC"- Accumulation over interval
"ITG"- Integration over interval
"NUM"- Number of valid data over interval
where "interval" is the interval between time points in the new time series.
The data type of the original time series data governs how values are interpolated. Data type "INST-VAL" (or "INST-CUM") considers the value to change linearly over the interval from the previous data value to the current value. Data type "PER-AVER" considers the value to be constant at the current value over the interval. Data type "PER-CUM" considers the value to increase from 0.0 (at the start of the interval) up to the current value over the interval.
How interpolation is performed for a specific data type influences the computation of new time series values for the selected function. For example, if the data type is "INST-VAL", the function "Maximum over interval" is evaluated by: Finding the maximum value of the data points from the original time series that are inclusive in the new time interval. Linearly interpolate values at beginning and ending of the new time interval, and determine if these values represent the maximum over the interval.
The "Average over interval" function is applied to a time series by integrating the area under the curve between interpolated points and dividing the result by the interval time.
See also: transformTimeSeries( string timeIntervalString, string timeOffsetString, string functionTypeString )
Parameters:
tsMath – A TimeSeriesMath object used to define the times for the new data set.
functionTypeString – A String specifying the method for computing values for the new time series data set.
Example: newTsData = tsValues.transformTimeSeries
(tsTimeTemplate, "MAX")
Returns: A new TimeSeriesMath object
Truncate to Whole Numbers
truncate()
Truncates values in a time series or paired data set to the nearest whole number. For example:
10.99 is truncated to 10.
The x-values in paired data sets are unaffected by the function, only the y-value data are truncated. Missing values remain missing.
For paired data, use the setCurve method to first select the curve(s).
See also: setCurve()
Parameters: Takes no parameters
Example: newDataSet = dataSet.truncate()
Returns: A new HecMath object of the same type as the current object
Two Variable Rating Table Interpolation
twoVariableRatingTableInterpolation(TimeSeriesMath tsDataX,TimeSeriesMath tsDataZ)
Derive a new time series data set by using the x-y curves in the current paired data set to perform two-variable rating table interpolation of the time series tsDataX and tsDataZ. For two-variable rating table interpolation, the current paired data set should have more than one curve (multiple sets of y-values).
As an example, reservoir release is a function of both the gate opening height and reservoir elevation is shown below. For each gate opening height, there is a reservoir elevation-reservoir release curve, where reservoir elevation is the independent variable (x-values) and reservoir release the dependent variable (y-values) of a paired data set. Each paired data curve has a curve label. In this case, the curve label is assigned the gate opening height. Using the paired data set shown, the function may be employed to interpolate time series values of reservoir elevation (tsDataX) and gate opening height (tsDataZ) to develop a time series of reservoir release.
No extrapolation is performed. If time series values from tsDataX or tsDataZ are outside the range bounded by the paired data, the new time series value is set to missing. Units and parameter type in the new time series are set to the y-units label and parameter of the current paired data set. All other names and labels are copied over from tsDataX.
Times for tsDataX and tsDataZ must match. Curve labels must be set for curves in the rating table paired data set and must be interpretable as numeric values. 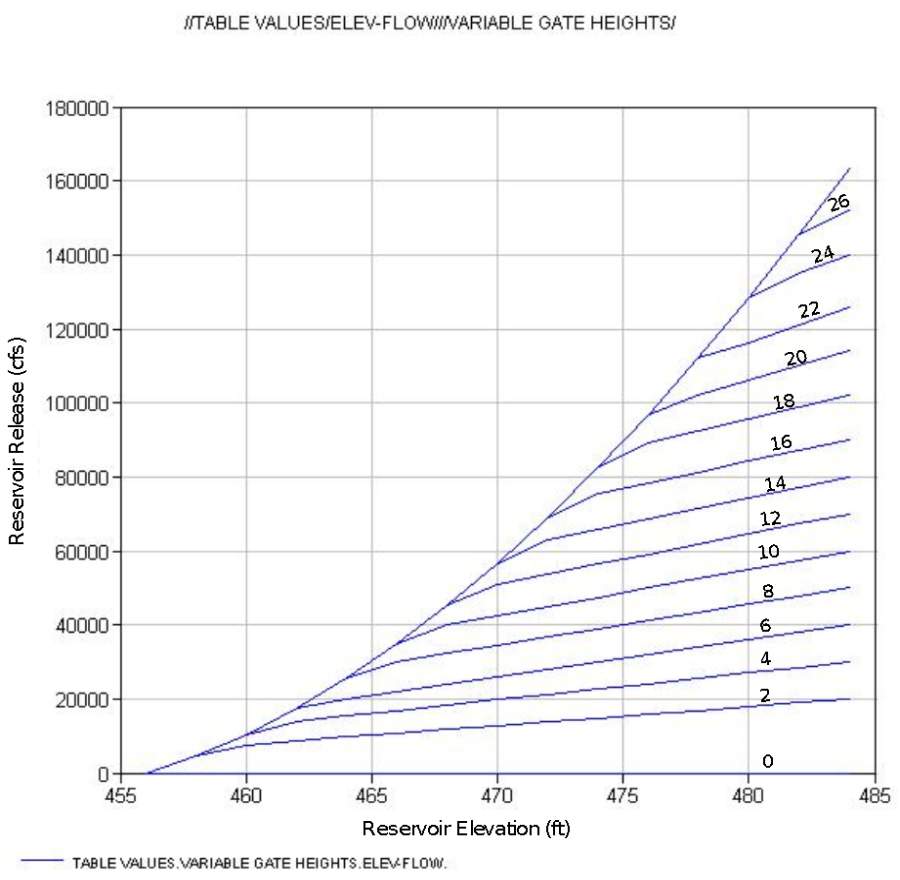
Example of two variable rating table paired data, reservoir release as a function of reservoir elevation and gate opening height (curve labels)
Parameters:
tsDataX – A regular or irregular interval TimeSeriesMath object, interpreted as x-ordinate values in the two variable interpolation.
tsDataZ – A regular or irregular interval TimeSeriesMath object, interpreted as z-ordinate values, (value defined by the paired data curve labels).
Example: tsOutflow = gateCurve.twoVariableRatingTable
Interpolation( tsElevation, tsGateOpening)
Returns: A new TimeSeriesMath object.
Generated Exceptions: Throws a HecMathException if times do not match for tsDataX and tsDataZ; if the paired data curve labels are blank or cannot be interpreted as number values.
Variance Function
variance(list of HecMath tsMathArray)
Determine the variance of the current time series and the each time series in the parameter, tsMathArray. A new time series will be created which duplicates the time points of the current time series. Where time points match for the current and tsMathArray, the values will be the variance of all time series for that time, provided the values for all time series are valid values (not missing). Points in the current time series which cannot be matched to valid points in tsMathArray are set to missing. Values in the current time series which are missing remain missing in the new time series.
The new time series will always have quality defined. For a specific time, if any of the quailty values in the current or parameter time series is questionable or rejected, the quality value for that time in the new time series will be set to the most severe quality for that time (e.g. if questionable and rejected are both encountered, the new quality will be set to rejected.)
Parameters: tsMathArray - the array of time series to be compared with the current time series.
Example: newDataSet =
dataSet.variance([ts1,ts2,ts3,ts4,ts5])
Returns: a new time series representing the variance of all time series.