Plotting Basics
Creating a plot
from hec.script import Plot

myPlot = Plot.newPlot()
# or
plot = Plot.newPlot("Oakville")
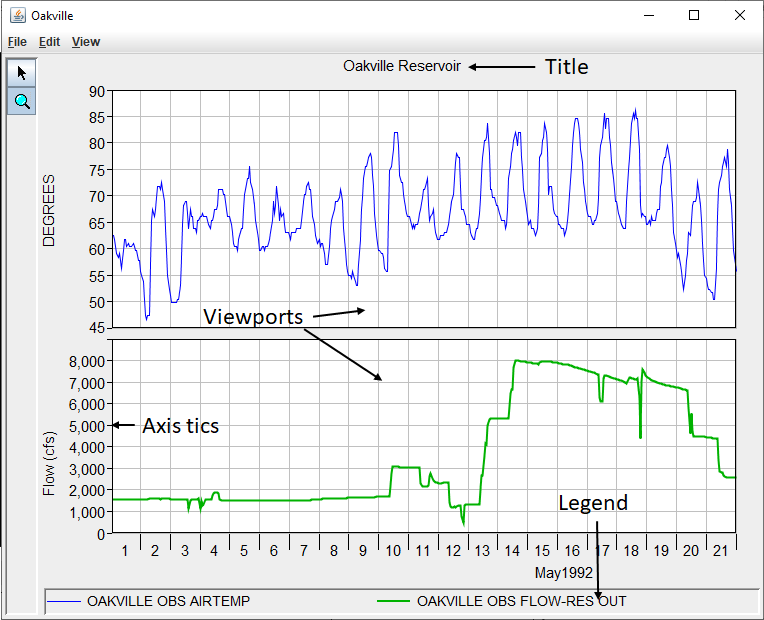
The title, viewport, axis label, axis tics, and legend of a plot, each of which are accessible via scripts, are identified in the plot below.
Plot Class
The Plot class in the hec.script module is used to create a new Plot dialog. It contains two methods to create a Plot dialog, each of which returns a G2dDialog object.
Plot.newPlot()
Plot.newPlot(string title)
Changing Plot Component Attributes
Not all Plot Component attributes are visible by default, and setting the attribute may not make that attribute visible. Often it is necessary to set the visibility of the attribute by calling setAttributeVisible(True). Reading a flow data set from a DSS file, plotting the data set, setting the minor Y grid color to black and making it display are illustrated in Example 23 below.
G2dDialog Class
Example 23: Plotting Dss Data
from hec.script import Plot
from hec.script.Constants import TRUE, FALSE
from hec.heclib.dss import HecDss
theFile = HecDss.open(r"C:\project\DSSVue-Example-Scripts\data\sample.dss")
thePath = "/AMERICAN/FOLSOM/FLOW-RES IN/01JAN2006/1DAY/OBS/"
flowDataSet = theFile.get(thePath)	# read a path name
thePlot = Plot.newPlot()	# create the plot
thePlot.addData(flowDataSet)	# add the flow data set to the plot
thePlot.showPlot()	# show the plot
viewport0=thePlot.getViewport(0)	# get the first viewport
viewport0.setMinorGridYColor("black")	# set the viewport's minor Y grid to black
viewport0.setMinorGridYVisible(TRUE) 	# tell the minor Y grid to display
thePlot.stayOpen()G2dDialog objects are the dialog that plots display in. G2dDialog methods are described in the table below.
G2dDialog Method | Returns | Description |
|---|---|---|
addData(DataContainer dc) | None | Add the DataContainer specified by dc to the plot. Must be called before showPlot(). Do not use this if a PlotLayout object is used on this plot. |
applyTemplate(string templateFile) | None | Apply the given template to this plot |
configurePlotLayout() | None | Display the "Configure Plot Layout" dialog for this plot |
configurePlotLayout(PlotLayout layout) | None | Configures the plot layout for this plot according to the specified PlotLayout object. If this method is used, do not use the addData() method with the same plot. |
close() | None | Closes the plot |
configurePlotTypes() | None | Display the configure plot types dialog |
copyToClipboard() | None | Copy the plot to the system clipboard |
defaultPlotProperties() | None | Display the default plot properties dialog |
exportProperties() | None | Allows you to save the properties of the plot to a disk. |
exportProperties(string templateName) | None | Allows you to save the properties of the plot to the file specified by templateName. |
getCurve(HecMath hm) | G2dLine | Return the G2dLine for the DataSet specified by dataSet |
Method | Returns | Description |
getCurve(string dssPath) | G2dLine | Return the G2dLine for the path specified in dssPath |
getHeight() | integer | Return the height of the dialog in screen coordinates. |
getLegendLabel(DataContainer dc) | G2dLabel | Return the legend label object for the specified data container. |
getLocation() | Point | Return the location of the dialog in screen coordinates.1 |
getPlotTitle() | G2dTitle | Return the title for the G2dDialog |
getPlotTitleText() | string | Return the text of the title for the G2dDialog |
getSize() | Dimension | Return the dimensions of the dialog in screen coordinates. |
getViewport(HecMath filenam) | Viewport | Return the Viewport that contains the curve specified by dataSet |
getViewport(integer viewportIndex) | Viewport | Return the viewport at index specified by viewportIndex |
getViewport(string dataSetPath) | Viewport | Return the Viewport that contains the curve specified by dataSetPath |
getWidth() | Integer | Return the width of the dialog in screen coordinates. |
hide() | None | Hide the dialog |
iconify() | None | Minimize (iconify) the dialog |
isPlotTitleVisible() | Boolean | Return the visibility state of the title of this plot. |
maximize() | None | Maximize the dialog |
minimize() | None | Minimize (iconify) the dialog |
newPlotLayout() | PlotLayout | Return a PlotLayout object that can be used to configure the layout of this plot. |
plotProperties() | None | Display the plot properties dialog for this plot |
print() | None | Display the print dialog for this plot |
Method | Returns | Description |
printMultiple() | None | Display the print multiple dialog for this plot |
printPreview() | None | Display the print preview dialog for this plot |
printToDefault() | None | Prints using the printer defaults such as page format and printer. This method does not display the printer dialog for user interaction. |
repaint() | None | Forces the plot to be refreshed. |
restore() | None | Restore the dialog from a minimized or maximized state |
saveAs() | None | Display the saveAs dialog for this plot |
saveToJpeg(string filename) | None | Save the plot to the Jpeg file specified by fileName |
saveToJpeg(string filename, integer quality) | None | Save the plot to the Jpeg file specified by filename, with the specified quality2. |
saveToMetafile(string filename) | None | Save the plot to the Windows Meta file specified by filename |
saveToPng(string filename) | None | Save the plot to the Portable Network Graphics file specified by filename |
saveToPostscript(string filename) | None | Save the plot to the PostScript file specified by filename |
setLegendBackgound(string color) | None | Sets the background color of the legend. |
setLegendLabelText(DataContainer dc, string text) | None | Sets the legend label text |
setLegendLocation(string location) | None | Sets the location of the legend3. |
setLocation(integer x,integer y) | None | Sets the location of the dialog in screen coordinates.1 |
setPlotTitleText(string text) | None | Sets the text of the title for this plot |
setPlotTitleVisible(Boolean state) | None | Sets the visibility of the title for this plot |
Method | Returns | Description |
setSize(integer width, integer height) | None | Sets the size of the dialog in screen coordinates. |
setVisible(Boolean visible) | None | Makes the plot visible |
showPlot() | None | Show the dialog |
stayOpen() | None | Keeps the plot on the screen for batch mode only |
tabulate() | HecDataTableFrame | Display the table view of this plot |
1 The coordinate system used is a graphics coordinate system, where X increases to the right and Y increases downward from the origin (0,0) which is located in the top left corner of the display. Locations set or retrieved refer to the top left corner of the plot in reference to this coordinate system.
2 The specified quality is limited to an effective range of 0 – 100, inclusive. Higher qualities produce larger files and take longer to generate. The saveToJpeg(fileName) call currently produces the same results as saveToJpeg(fileName, 75).
3 Valid legend locations are "Right" and "Bottom".
Example 24: Plot-Dialog
from hec.script import Plot
from hec.script.Constants import TRUE, FALSE
from hec.heclib.dss import HecDss
theFile = HecDss.open(r"C:\project\DSSVue-Example-Scripts\data\sample.dss")
thePath = "/AMERICAN/FOLSOM/FLOW-RES IN/01JAN2006/1DAY/OBS/"
flowDataSet = theFile.get(thePath)	# read a path name
thePlot = Plot.newPlot()	# create the plot
thePlot.addData(flowDataSet)	# add the flow data set to the plot
thePlot.showPlot()	# show the plot
thePlot.stayOpen() # keep the plot openPlotLayout Class
PlotLayout objects hold information about the layout of the plot dialog. The use of ViewportLayout objects, in conjunction with PlotLayout objects, allows scripts to specify the same layout information accessible interactive via the "Configure Plot Layout" dialog. A PlotLayout object is obtained by calling Plot.newPlotLayout(). PlotLayout methods are described in the table below.
PlotLayout Methods
PlotLayout Method | Returns | Description |
|---|---|---|
addViewport() | ViewportLayout | Adds a ViewportLayout to the PlotLayout with a default weight of 100. Returns a reference to the new ViewportLayout. |
addViewport(floating-point weight) | ViewportLayout | Adds a ViewportLayout to the PlotLayout with the specified weight. Returns a reference to the new ViewportLayout. |
hasLegend() | Boolean | Returns whether this PlotLayout is configured to display the legend. |
hasToolbar() | Boolean | Returns whether this PlotLayout is configured to display the toolbar. |
getViewportCount() | integer | Returns the number of ViewportLayout objects currently in the PlotLayout object. |
getViewports() | java.util.List of ViewportLayouts | Returns the ViewportLayout objects currently in the PlotLayout object. |
getViewportWeights() | list of floating-points | Returns the weights of the ViewportLayout objects currently in the PlotLayout object. |
setHasLegend(Boolean state) | None | Configures the PlotLayout object to display the legend or not, depending upon the specified state. |
setHasToolbar(Boolean state) | None | Configures the PlotLayout object to display the toolbar or not, depending upon the specified state. |
ViewportLayout Class
ViewportLayout objects hold information about the layout of an individual viewport within the plot dialog. The use of ViewportLayout objects, in conjunction with PlotLayout objects, allows scripts to specify the same layout information accessible interactive via the "Configure Plot Layout" dialog. A ViewportLayout object is obtained by calling one of the addViewport methods of a PlotLayout object.
ViewportLayout objects are only used to configure the plot layout. Manipulation of axis labels, background colors, etc. is performed using Viewport objects as described in table below. ViewportLayout methods are described in the table below.
ViewportLayout Methods
ViewportLayout Method | Returns | Description |
|---|---|---|
addCurve(string axis, DataContainer curve) | None | Adds the specified curve to the specified axis of the ViewportLayout object. |
getMajorGridXStyleString() | string | |
getMajorGridYStyleString() | string | |
getMinorGridXStyleString() | string | |
getMinorGridYStyleString() | string |
Method | Returns | Description |
getY1Data() | List | Returns a java.util.List of all curves that have been added to the Y1 axis of this object |
getY2Data() | List | Returns a java.util.List of all curves that have been added to the Y2 axis of this object |
hasY1Data() | Boolean | Returns whether any curves have been added to the Y1 axis of this object |
hasY2Data() | Boolean | Returns whether any curves have been added to the Y2 axis of this object |
setMajorGridXStyleString( string majorGridXStyle) | None | |
setMajorGridYStyleString( string majorGridYStyle) | None | |
setMinorGridXStyleString( string minorGridXStyle) | None | |
setMinorGridYStyleString( string minorGridYStyle) | None | |
setLinear(string axisName) | None | |
setLogarithmic(string axisName) | None | |
scaleAxisFromOpposite( string axis) | None |
The script in Example 25 reads precipitation, stage and flow data set from a DSS file, and configures a plot to display the precipitation on top in a viewport that occupies thirty percent of the available space and to display the stage and flow on separate axes of a bottom viewport that occupies the remaining seventy percent of available space.
Example 25: PlotLayout and ViewportLayout Objects
from hec.script import Plot
from hec.heclib.dss import HecDss
theFile = HecDss.open("myFile.dss")# open myFile.dss
precipPath = "/BASIN/LOC/FLOW/01NOV2002/1HOUR/OBS/"
stagePath = "/BASIN/LOC/FLOW/01NOV2002/1HOUR/OBS/"
flowPath = "/BASIN/LOC/FLOW/01NOV2002/1HOUR/OBS/"
precipData = theFile.get(precipPath)# read the precip
stageData = theFile.get(stagePath)# read the stage
flowData = theFile.get(flowPath)# read the flow
thePlot = Plot.newPlot()# create a new Plot
layout = Plot.newPlotLayout()# create a new PlotLayout
topView = layout.addViewport(30)# get the top viewport
bottomView = layout.addViewport(70)# get the bottom viewport
topView.addCurve("Y1", precipData)# add the precip to top
bottomView.addCurve("Y1", stageData)# add the stage to bottom
bottomView.addCurve("Y2", flowData)# add the flow to bottom
thePlot.configurePlotLayout(layout)# configure the plot
thePlot.showPlot()# show the plotViewport Class
Viewport objects hold the data set curves. Viewport methods are described in the table below.
Viewport Methods
Viewport Method | Returns | Description |
|---|---|---|
addAxisMarker(AxisMarker marker) | None | Adds a marker line described by the AxisMarker parameter |
addXAxisMarker() | None | Display the Axis Marker Properties Dialog for a marker line to add to the X axis |
addXAxisMarker(floating-point value) | None | Add an X Axis marker at the location specified by value |
addXAxisMarker(string value) | None | Add a X Axis marker at the location specified by value |
addYAxisMarker() | None | Display the Axis Marker Properties Dialog for a marker line to add to the Y axis |
addYAxisMarker(string value) | None | Add a Y Axis marker at the location specified by value |
editProperties() | None | Display the Edit Properties dialog for this Viewport |
getAxis(string axisName) | Axis | Return the Axis specified by axisName for this Viewport |
getAxisLabel(string axisName) | AxisLabel | Return the AxisLabel for the axis specified by axisName for this Viewport |
getAxisTics(string axisName) | AxisTics | Return the AxisTics for the axis specified by axisName for this Viewport |
getBackground() | Color | Return the background color for the Viewport as a Color. |
getBackgroundString() | string | Return the background color name for the Viewport as a string. |
getBorderColor() | Color | Return the border color for the Viewport as a Color. |
getBorderColorString() | string | Return the background color name for the Viewport as a string |
getBorderWeight() | float | Return the border weight for this Viewport |
getFillPatternString() | string | Return the fill pattern for this Viewport as a String |
getMajorGridXColor() | Color | Return the color of the vertical lines of the major grid for this Viewport as a Color |
Method | Returns | Description |
getMajorGridXColorString () | string | Return the color of the vertical lines of the major grid for this Viewport as a string |
getMajorGridXWidth () | floating point | Return the width of the vertical lines of the major grid for this Viewport |
getMajorGridYColor () | Color | Return the color of the horizontal lines of the major grid of this Viewport as a Color |
getMajorGridYColorString () | string | Return the color of the horizontal lines of the major grid for this Viewport as a string |
getMajorGridYWidth () | floating point | Return the width of the vertical lines of the major grid for this Viewport |
getMinorGridXColor() | Color | Return the color of the vertical lines of the minor grid for this Viewport as a color |
getMinorGridXColorString() | string | Return the color of the vertical lines of the minor grid for this Viewport as a string |
getMinorGridXWidth() | floating point | Return the width of the vertical lines of the minor grid for this Viewport |
getMinorGridYColor() | Color | Return the color of the horizontal lines of the minor grid for this Viewport as a Color. |
getMinorGridYColorString() | string | Return the color of the horizontal lines of the minor grid for this Viewport as a string |
getMinorGridYWidth() | floating point | Return the width of the vertical lines of the minor grid for this Viewport |
isBackgroundVisible() | Boolean | Return whether the background is drawn for this Viewport |
isBorderVisible() | Boolean | Return whether the border is drawn for this Viewport |
isMajorGridXVisible() | Boolean | Return whether the vertical lines of the major grid are drawn for this Viewport |
isMajorGridYVisible () | Boolean | Return whether the horizontal lines of the major grid are drawn for this Viewport |
Method | Returns | Description |
|---|---|---|
isMinorGridXVisible() | Boolean | Return whether the vertical lines of the minor grid are drawn for this Viewport |
isMinorGridYVisible () | Boolean | Return whether the horizontal lines of the minor grid are drawn for this Viewport |
setBackground(string colorString) | None | Set the background to the color specified by colorString |
setBorderColor(string borderColor) | None | Set the border color for this Viewport |
setBorderWeight(floating-point borderWeight) | None | Set the border weight for this Viewport |
setBackgroundVisible(Boolean state) | None | Set whether to draw the background for this Viewport |
setBorderVisible(Boolean state) | None | Set whether to draw the border for this Viewport |
setFillPattern(string pattern) | None | Set the fill pattern for this Viewport |
setGridColor(string colorString) | None | Set the color of the horizontal and vertical lines of the major and minor grids for this Viewport. |
setGridXColor(string colorString) | None | Set the color of the vertical lines of the major and minor grids for this Viewport. |
setGridYColor(string colorString) | None | Set the color of the horizontal lines of the major and minor grids for this Viewport. |
setMajorGridXColor(string majorGridXColor) | None | Set the color of the vertical lines of the major grid for this Viewport. |
setMajorGridXVisible(Boolean state) | None | Set whether to draw the vertical lines of the major grid for this Viewport |
setMajorGridXWidth(floating-point gridLineWidth) | None | Set the width of the vertical lines of the major grid for this Viewport |
setMajorGridYColor(string majorGridYColor) | None | Set the color of the horizontal lines of the major grid for this Viewport. |
setMajorGridYVisible(Boolean state) | None | Set whether to draw the horizontal lines of the major grid for this Viewport |
setMajorGridYWidth(floating-point gridLineWidth) | None | Set the width of the horizontal lines of the major grid for this Viewport |
setMinorGridXColor(string minorGridXColor) | None | Set the color of the vertical lines of the minor grid for this Viewport. |
Method | Returns | Description |
|---|---|---|
setMinorGridXVisible(Boolean state) | None | Set whether to draw the vertical lines of the minor grid for this Viewport |
setMinorGridXWidth(floating-point gridLineWidth) | None | Set the width of the vertical lines of the minor grid for this Viewport |
setMinorGridYColor(string minorGridYColor) | None | Set the color of the horizontal lines of the minor grid for this Viewport. |
setMinorGridYVisible(Boolean state) | None | Set whether to draw the horizontal lines of the minor grid for this Viewport |
setMinorYGridWidth(floating-point gridLineWidth) | None | Set the width of the horizontal lines of the minor grid for this Viewport |
AxisMarker Class
AxisMarker objects hold complete descriptions of marker lines to be added to viewports. AxisMarker objects have fields that are settable by the user to create marker lines of various styles. New AxisMarker objects are created by calls to AxisMarker() (e.g., myMarker = AxisMarker()).
AxisMarker fields are described below.
AxisMarker Fields
AxisMarker Field | Type | Description | Default |
|---|---|---|---|
axis | string | "X" or "Y" | "Y" |
fillColor | string | Color of the filled area. | "black" |
fillPattern | string | Pattern of the filled area. | "solid" |
fillStyle | string | Specifies whether the filled area is to be above or below the marker line, or to not fill at all. | "none" |
labelAlignment | string | Specifies whether the label text is to appear left justified, right justified or centered. | "left" |
labelColor | string | Color of the label text | "black" |
labelFont | string | The font to use for the label.1 | None |
labelPosition | string | Specifies whether the label text is to appear above, below, or in the center of the marker line | "above" |
labelText | string | Text to appear with marker line | "" |
lineColor | string | Color of the marker line | "black" |
lineStyle | string | Style of the marker line | "solid" |
lineWidth | floating point | Width of the marker line | 1.0 |
value | string | Location of marker on axis (e.g. "712.5" or "23Aug2003 1015") | "0" |
1 Fonts are specified as name[,style[,size]] where style is Plain, Bold, Italic, or Bold Italic (e.g. "Arial,BoldItalic,12", "Lucida Console,Plain,10").
The script in Example 26 reads a data set from a DSS file, plots that data set, sets the Viewport's background to light gray and adds a marker line on the Y axis.
Example 26: Viewport Class
from hec.script import Plot	# for Plot class
from hec.script.Constants import TRUE, FALSE
from hec.heclib.dss import HecDss	# for DSS class
theFile = HecDss.open("myFile.dss")	# open myFile.dss
thePath = "/BASIN/LOC/FLOW/01NOV2002/1HOUR/OBS/"
flowDataSet = theFile.read(thePath)	# read a path name
thePlot = Plot.newPlot()	# create a new Plot
thePlot.addData(flowDataSet)	# add the flow data
viewport0=thePlot.getViewport(0)	# get the first Viewport
viewport0.setBackground("lightgray")	# set the Viewport's bg
viewport0.setBackgroundVisible(TRUE) 	# tell Viewport to draw bg
marker = AxisMarker()	# create a new marker
marker.axis = "Y" 	# set the axis
marker.value = "20000" 	# set the value
marker.labelText = "Damaging Flow" 	# set the text
marker.labelColor = "red" 	# set the text color
marker.lineColor = "red" 	# set the line color
marker.fillColor = "red" 	# set the fill color
marker.fillType = "above" 	# set the fill type
maker.fillPattern = "diagonal cross" 	# set the fill pattern
viewport0.addAxisMarker(marker) 	# add the marker to the
	                # viewport
Axis Class
Axis methods are described in the table below.
Axis Methods
Axis Method | Returns | Description |
|---|---|---|
getLabel() | string | Return the Axis label |
getMajorTic() | floating-point | Return the major tic interval for this Axis |
getMinorTic() | floating-point | Return the minor tic interval for this Axis |
getNumTicLabelLevels() | integer | Return the number of tic label levels for this Axis |
Method | Returns | Description |
getScaledLabel() | String | Return the label with scientific notation |
getScaleMax() | floating-point | Return the maximum value for this Axis |
getScaleMin() | floating-point | Return the minimum value for this Axis |
getTicColor() | Color | Return the tic color |
getTicColorString() | String | Return the Tic color as a String |
getTicTextColor() | Color | Return the tic text color |
getTicTextColorString() | String | Return the tic text color as a String |
getViewMax() | floating-point | Return the maximum value for the (possibly) zoomed view for this Axis |
getViewMin() | floating-point | Return the minimum value for the (possibly) zoomed view for this Axis |
isComputingMajorTics() | Boolean | Return if major tics are to be computed |
isComputingMinorTics() | Boolean | Return if minor tics are to be computed |
isReversed() | Boolean | Returns whether the Axis is reversed.1 |
setComputeMajorTics(Boolean state) | None | Set whether to compute major tics |
setComputeMinorTics(Boolean state) | None | Set whether to compute minor tics |
setLabel(string label) | None | Set the label of this Axis |
setLinear() | None | |
setLogarithmic | None | |
setMajorTicInterval(floating-point interval) | None | Set the major tic interval for this Axis to interval |
setMinorTicInterval(floating-point interval) | None | Set the minor tic interval for this Axis to interval |
setNumTicLabelLevels(integer layers) | None | Set the maximum number of tic label layers to specified number. -1 is unrestricted. Used mostly for time series axis. |
setReversed(Boolean state) | None | Set the reversed state of the Axis.1 |
setScaleLimits(floating-point min, floating-point max) | None | Sets the minimum and maximum values for the axis (range of un-zoomed view) |
setTicColor(String colorString) | None | Set the tic color to the color represented by colorString |
Method | Returns | Description |
|---|---|---|
setTicTextColor(String colorString) | None | Set the tic text color to the color represented by colorString |
setViewLimits(floating-point min, floating-poin max) | None | Zooms based on world coordinates |
unZoom() | None | Returns the view to the full axis range. |
zoomByFactor(floating-point factor) | None | Change the zoom scaling by the given factor |
1 The coordinate system used is a graphics coordinate system with the origin (0,0) located at the top left corner of the display, with X increasing to the right and Y increasing downward. The reversed state is in respect to this coordinate system (i.e. Y is reversed if it increases upward).
The script in Example 27 reads a data set from a DSS file, adds that data set to a new Plot, and zooms in on the Y Axis.
Example 27: Using Axis Objects
from hec.script import Plot# for Plot class
from hec.heclib.dss import HecDss# for DSS class
thePlot = Plot.newPlot()# create a Plot
dssFile = HecDss.open("mydb.dss")# open the DSS file
flow = dssFile.get("/BASIN/LOC/FLOW/01NOV2002/1HOUR/OBS/")

#read a data set
thePlot.addData(flow) # add the data set
thePlot.showPlot()# show the plot
viewport0 = thePlot.getViewport(0)# get the first Viewport
yaxis = viewport0.getAxis("Y1")# get the Y1 axis
yaxis.setScaleLimits(0., 25000.) # set the scale
yaxis.zoomByFactor(.5)# zoom inAxisTics Class
AxisTics methods are described in the tablesbelow.
AxisTics Methods
AxisTics Method | Returns | Description |
|---|---|---|
areMajorTicLabelsVisible() | Boolean | Return whether the major tic labels are visible. |
areMajorTicsVisible() | Boolean | Return whether the major tics are visible |
areMinorTicLabelsVisible() | Boolean | Return whether the minor tic labels are visible |
areMinorTicsVisible() | Boolean | Return whether the minor tics are visible |
Method | Returns | Description |
computeRatingFromOppositeAxis() | None | When used on the right (Y2) AxisTics object, with related curves on the Y1 and Y2 axes (e.g. stage and flow, or elevation and storage), causes the AxisTics to behave in a non-linear fashion such that Y1 and Y2 curves are coincident. |
editProperties() | None | Display the Edit Properties Dialog for the AxisTics |
getAxis() | Axis | Returns a reference to the axis that this object draws |
getAxisTicColor() | Color | Return the tic color |
getAxisTicColorString() | String | Return the tic color as a String |
getFontSizes() | tuple of 3 integers | Return the regular, tiny, min and max font sizes for this AxisTics |
getMajorTicLength() | Integer | Return the major tic length |
getMinorTicLength() | integer | Return the minor tic length |
setAxisTicColor(string colorString) | None | Set the tic color to the color represented by colorString |
setFontSizes(integer sz,integer tiny, integer min, intege max) | None | Set the regular, tiny, min and max font sizes for this AxisTics |
setMajorTicLabelsVisible(Boolean state) | None | Set the visibility of the major tic labels |
setMajorTicLength(int ticLength) | None | Set the major tic length |
setMajorTicsVisible(Boolean state) | None | Set the visibility of the major tics |
setMinorTicLabelsVisible(Boolean state) | None | Set the visibility of the minor tic labels. |
setMinorTicLength(int ticLength) | None | Set the minor tic length |
setMinorTicsVisible(Boolean state) | None | Set the visibility of the minor tics |
The script in Example 28 creates a new Plot with a data set read from DSS and tells the data set's axis tics to draw its minor tic marks.
Example 28: Using AxisTics Objects
from hec.script import Plot
from hec.script.Constants import TRUE, FALSE
from hec.heclib.dss import HecDss
thePlot = Plot.newPlot() # create a Plot
dssFile = HecDss.open("c:/temp/mydb.dss") # open the DSS file
flow = dssFile.get("/BASIN/LOC/FLOW/01NOV2002/1HOUR/OBS/")

#read a data set
thePlot.addData(flow) # add the data set
thePlot.showPlot()# show the plot
viewport0 = thePlot.getViewport(flow)# get the viewport for the #flow data set
yAxisTics = viewport0.getAxisTics("Y1")# get the axis tics for the #Viewport
yAxisTics.setMinorTicsVisible(TRUE) # tell axis tics to show ticsG2dLine Class
G2dLine methods are described below.
G2dLine Methods
G2dLine Method | Returns | Description |
|---|---|---|
areSymbolsAutoInterval() | Boolean | Return whether the symbols for this line are placed at program-decided intervals |
areSymbolsVisible() | Boolean | Return whether this line draws its symbols |
editLineProperties() | None | Method that allows the editing of line properties. This method displays a visible dialog for line editing. |
getFillColor() | Color | Return the fill color for this line |
getFillColorString() | string | Return the fill color for this line as a String |
getFillPatternString() | string | Return the fill pattern for this line as a String |
getFillTypeString() | string | Return the Fill type for this line as a String. |
getFirstSymbolOffset() | integer | Return the offset for the first symbol for this line |
getLineColor() | Color | Return the line color for this line |
getLineColorString() | string | Return the line color for this line as a String |
getLineStepStyleString() | string | Return the line step style for this line as a String |
getLineStyleString() | string | Return the line style for this line as a string |
getLineWidth() | floating-point | Return the Line Width of the line |
getNumPoints() | integer | Returns the Number of Points that this line has |
getSymbolFillColor() | Color | Return the symbol fill color for this line's symbols |
getSymbolFillColorString() | string | Return the symbol fill color for this line's symbols as a String |
getSymbolInterval() | integer | Return the interval of data points (>0) on which symbols are drawn. |
getSymbolLineColor() | Color | Return the symbol line color for this line's symbols |
getSymbolLineColorString() | string | Return the symbol line color for this line's symbols as a String |
getSymbolSize() | floating-point | Return the symbol size for this line |
Method | Returns | Description |
getSymbolSkipCountl() | integer | Return the number of points skipped between symbols (same as getSymbolInterval() – 1) |
getSymbolTypeString() | string | Return the symbol type for this line as a string |
isLineVisible() | Boolean | Return this line is drawn |
setFillColor(string fillColor) | None | Set the fill color for this line |
setFillPattern(string fillPattern) | None | Set the fill pattern for this line |
setFillType(string fillType) | None | Set the Fill type for this line |
setFirstSymbolOffset(integer offset) | None | Set the offset for first symbol for this line |
setLineColor(string lineColor) | None | Set the line color for this line |
setLineStepStyle(string stepStyle) | None | Set the line step style for this line |
setLineStyle(string style) | None | Set the line style for this line |
setLineVisible(Boolean state) | None | Set whether to draw this line |
setLineWidth(floating-point width) | None | Set the width for this line |
setSymbolFillColor(string symbolFillColor) | None | Set the symbol fill color for this line's symbols |
setSymbolInterval(integer interval) | None | Set the interval of data points (>0) on which symbols are drawn. |
setSymbolLineColor(string symbolLineColor) | None | Set the symbol line color for this line's symbols |
setSymbolsAutoInterval(Boolean state) | None | Set whether to have the program decide the interval at which to draw symbols |
setSymbolSize(floating-point size) | None | Set the symbol size for this line |
setSymbolSkipCount(integer count) | None | Set the number of points skipped between symbols. |
setSymbolsVisible(Boolean state) | None | Set whether to draw the symbols for this line |
setSymbolType(string symbolType) | None | Set the symbol type for this line |
The script in Example 29 creates a plot with a data set read from DSS, the script then tells that data set's curve to draw its symbols auto skipped.
Example 29: Using G2dLine Objects
from hec.script import Plot
from hec.script.Constants import TRUE, FALSE
from hec.heclib.dss import HecDss
thePlot = Plot.newPlot() # create a Plot
dssFile = HecDss.open("C:/temp/mydb.dss") # open the DSS file
stage = dssFile.get("/BASIN/LOC/FLOW/01NOV2002/1HOUR/OBS/")

#read a data set
thePlot.addData(stage) # add the data set
thePlot.showPlot()# show the plot
stageCurve = thePlot.getCurve(stage)# get the stage curve
stageCurve.setSymbolsAutoInterval(TRUE)# turn on symbols auto skipG2dLabel, G2dTitle, and AxisLabel Classes
G2dLabel, G2dTitle and AxisLabel methods are described below.
Label Methods
Label Method | Returns | Description |
|---|---|---|
editProperties() | None | Display the Edit Properties Dialog for the label |
getAlignmentString() | string | Return the text alignment for this label as a String |
getBackground() | Color | Return the background color for the label1 |
getBackgroundString() | string | Return the background color for the label as a String1 |
getBorderStyleString() | string | Return the border style for this label as a string |
getBorderWeight() | floating-point | Return the border weight for this label |
getFillColor() | Color | Return the fill color for this label as a Color1 |
getFillColorString() | string | Return the fill color for this label as a string1 |
getFillPatternString() | string | Return the fill pattern for this label as a string1 |
getFontFamily() | string | Return the font family for the label |
getFontSize() | integer | Return the font size for the label |
getFontSizes() | tuple of 3 integers | Return the regular, tiny, min and max font sizes for this label |
getFontString() | string | Return the font for the label as a string2. |
getFontStyleString() | string | Return the font style for the label as a String |
getForeground() | Color | Return the foreground color for the label |
getForegroundString() | string | Return the foreground color for the label as a String |
getIcon() | Icon | Return the Icon to display for this label |
getIconPath() | string | Return the Icon path to display for this label |
getRotation() | integer | Return the text rotation for this label |
getSpacing() | integer | Return the spacing around this label |
getText() | string | Return the text for the label |
isBackgroundVisible() | Boolean | Return whether the background is visible |
isBorderVisible() | Boolean | Return whether the border is visible |
setAlignment(string alignment) | None | Set the text alignment for this label |
Method | Returns | Description |
setBackground(string colorString) | None | Set the background color for the label1 |
setBackgroundVisible(Boolean state) | None | Set the background visibility for the label |
setBorderColor(string colorString) | None | Set the border color for this label |
setBorderStyle(string style) | None | Set the border style for this label |
setBorderVisible(Boolean state) | None | Set the border visibility for this label |
setBorderWeight(floating-point weight) | None | Set the border weight for this label |
setFillColor(string color) | None | Set the fill color for this label1 |
setFillPattern(string pattern) | None | Set the fill pattern for this label1 |
setFont(string font) | None | Set the font for the label2. |
setFontFamily(string fam) | None | Set the font family for the label |
setFontSize(integer sz) | None | Set the font size for the label |
setFontSizes(integer sz, integer tiny, integer min, integer max) | None | Set the regular, tiny, min and max font sizes for this label |
setFontStyle(string style) | None | Set the font style for the label |
setForeground(string colorString) | None | Set the foreground color for the label |
SetIcon(Icon icon) | None | Set the Icon to display for this label |
SetIcon(string iconPath) | None | Set the Icon to display for this label |
setRotation(integer rotation) | None | Set the text rotation for this label |
setSpacing(integer space) | None | Set the spacing around this label |
SetText(string text) | None | Set the text for the label |
1 In the current version, fill color and background color are synonymous (e.g. fills are performed with the background color). Future version may support separate fill and background colors.
2 Fonts are specified as name[,style[,size]] where style is Plain, Bold, Italic, or Bold Italic (e.g. “Arial,BoldItalic,12”, “Lucida Console,Plain,10”).
The script in Example 30 creates a plot from a DSS data set and sets the Y1 axis label text to blue.
Example 30: Using AxisLabel Objects
from hec.script import Plot
from hec.heclib.dss import HecDss
thePlot = Plot.newPlot()# create a Plot
dssFile = HecDss.open("C:/temp/mydb.dss")# open the DSS file
flow = dssFile.get("/BASIN/LOC/FLOW/01NOV2002/1HOUR/OBS/")

#read a data set
thePlot.addData(flow) # add the data set
thePlot.showPlot()# show the plot
viewport0 = thePlot.getViewport(0)# get the first viewport
yaxislabel = viewport0.getAxisLabel("Y1")# get the Y1 axis label
yaxislabel.setForeground("blue")# set the Y1 axis label text to blueTemplates
Template files saved interactively from HEC-DSSVue may be applied to plots via scripting. When saving a template interactively from the plot window via the "Save Template…" entry on the "File" menu, HEC-DSSVue:
1. Chooses the "My Documents" subdirectory of the directory specified in the USERPROFILE environment variable as the default location for the template file.
2. Appends ".template" to the end of the specified file name.
The applyTemplate(string filename) G2dDialog method requires a file name for the template file. To apply a template saved in the default directory, the complete template file name must be re-created as demonstrated in Example 31.
Example 31: Applying Templates
import os# for getenv() & sep
from hec.script import Plot # for Plot class
from hec.heclib.dss import HecDss # for DSS class
thePlot = Plot.newPlot() # create a Plot
dssFile = HecDss.open("C:/temp/mydb.dss") # open the DSS file
flow = dssFile.get("/BASIN/LOC/FLOW/01NOV2002/1HOUR/OBS/")

#read a data set
thePlot.addData(flow) # add the data set
thePlot.showPlot()# show the plot
templateName = "myTemplate"# template base name
templateFileName =os.getenv("userprofile") \
+ os.sep \
+ "My Documents" \
+ os.sep \
+ templateName \
+ ".template"
thePlot.applyTemplate(templateFileName)# apply the template