Alternative Comparison Report Results
An alternative comparison report provides information about the damage reduced between the without-project condition and with-project conditions. Damage reduced is also referred to as benefits. The information about damage reduced is available for both damage measures: expected annual damage (EAD) and equivalent annual damage (EqAD). If EAD reduced is of interest, an analysis year must be selected. Only EqAD reduced should be used in comparison with equivalent annual cost to calculate net benefits and the benefit to cost ratio. Four reports are available: damage with uncertainty, damage by impact area, damage by damage category, and a summary report. In what follows, we'll refer to "damage" generally, which should be taken to represent either EAD or EqAD, the reports work the same for either measure except that expected annual damage reports will reflect either the base year or the most likely future year. All compute algorithms in HEC-FDA Version 2.0 are the same as those found in HEC-FDA Version 1.4.3, except those identified in the HEC-FDA Version 2.0 Release Notes.
Damage with Uncertainty
The distribution of damage reduced is a function of the distribution of with-project damage and the distribution of without-project damage. Perfect correlation is assumed between distributions. On the top left-hand corner of the report, mean damage reduced is displayed, underneath which a table of the first, second, and third quartiles of the damage reduced distribution are displayed. On the right-hand side of the report, the distribution of damage reduced is displayed.
Below is a screenshot of AAEQ damages reduced across all damage categories and impact areas.

Below is a screenshot of EAD reduced across all damage categories and impact areas for the base year condition.

Damage by Impact Area
The damage by impact area report displays the mean EqAD reduced or EAD reduced for each impact area between the without-project condition and the selected with-project condition.
Below is a screenshot of EAD reduced across all damage categories by impact area for the base year condition. The same report can be displayed for EqAD.
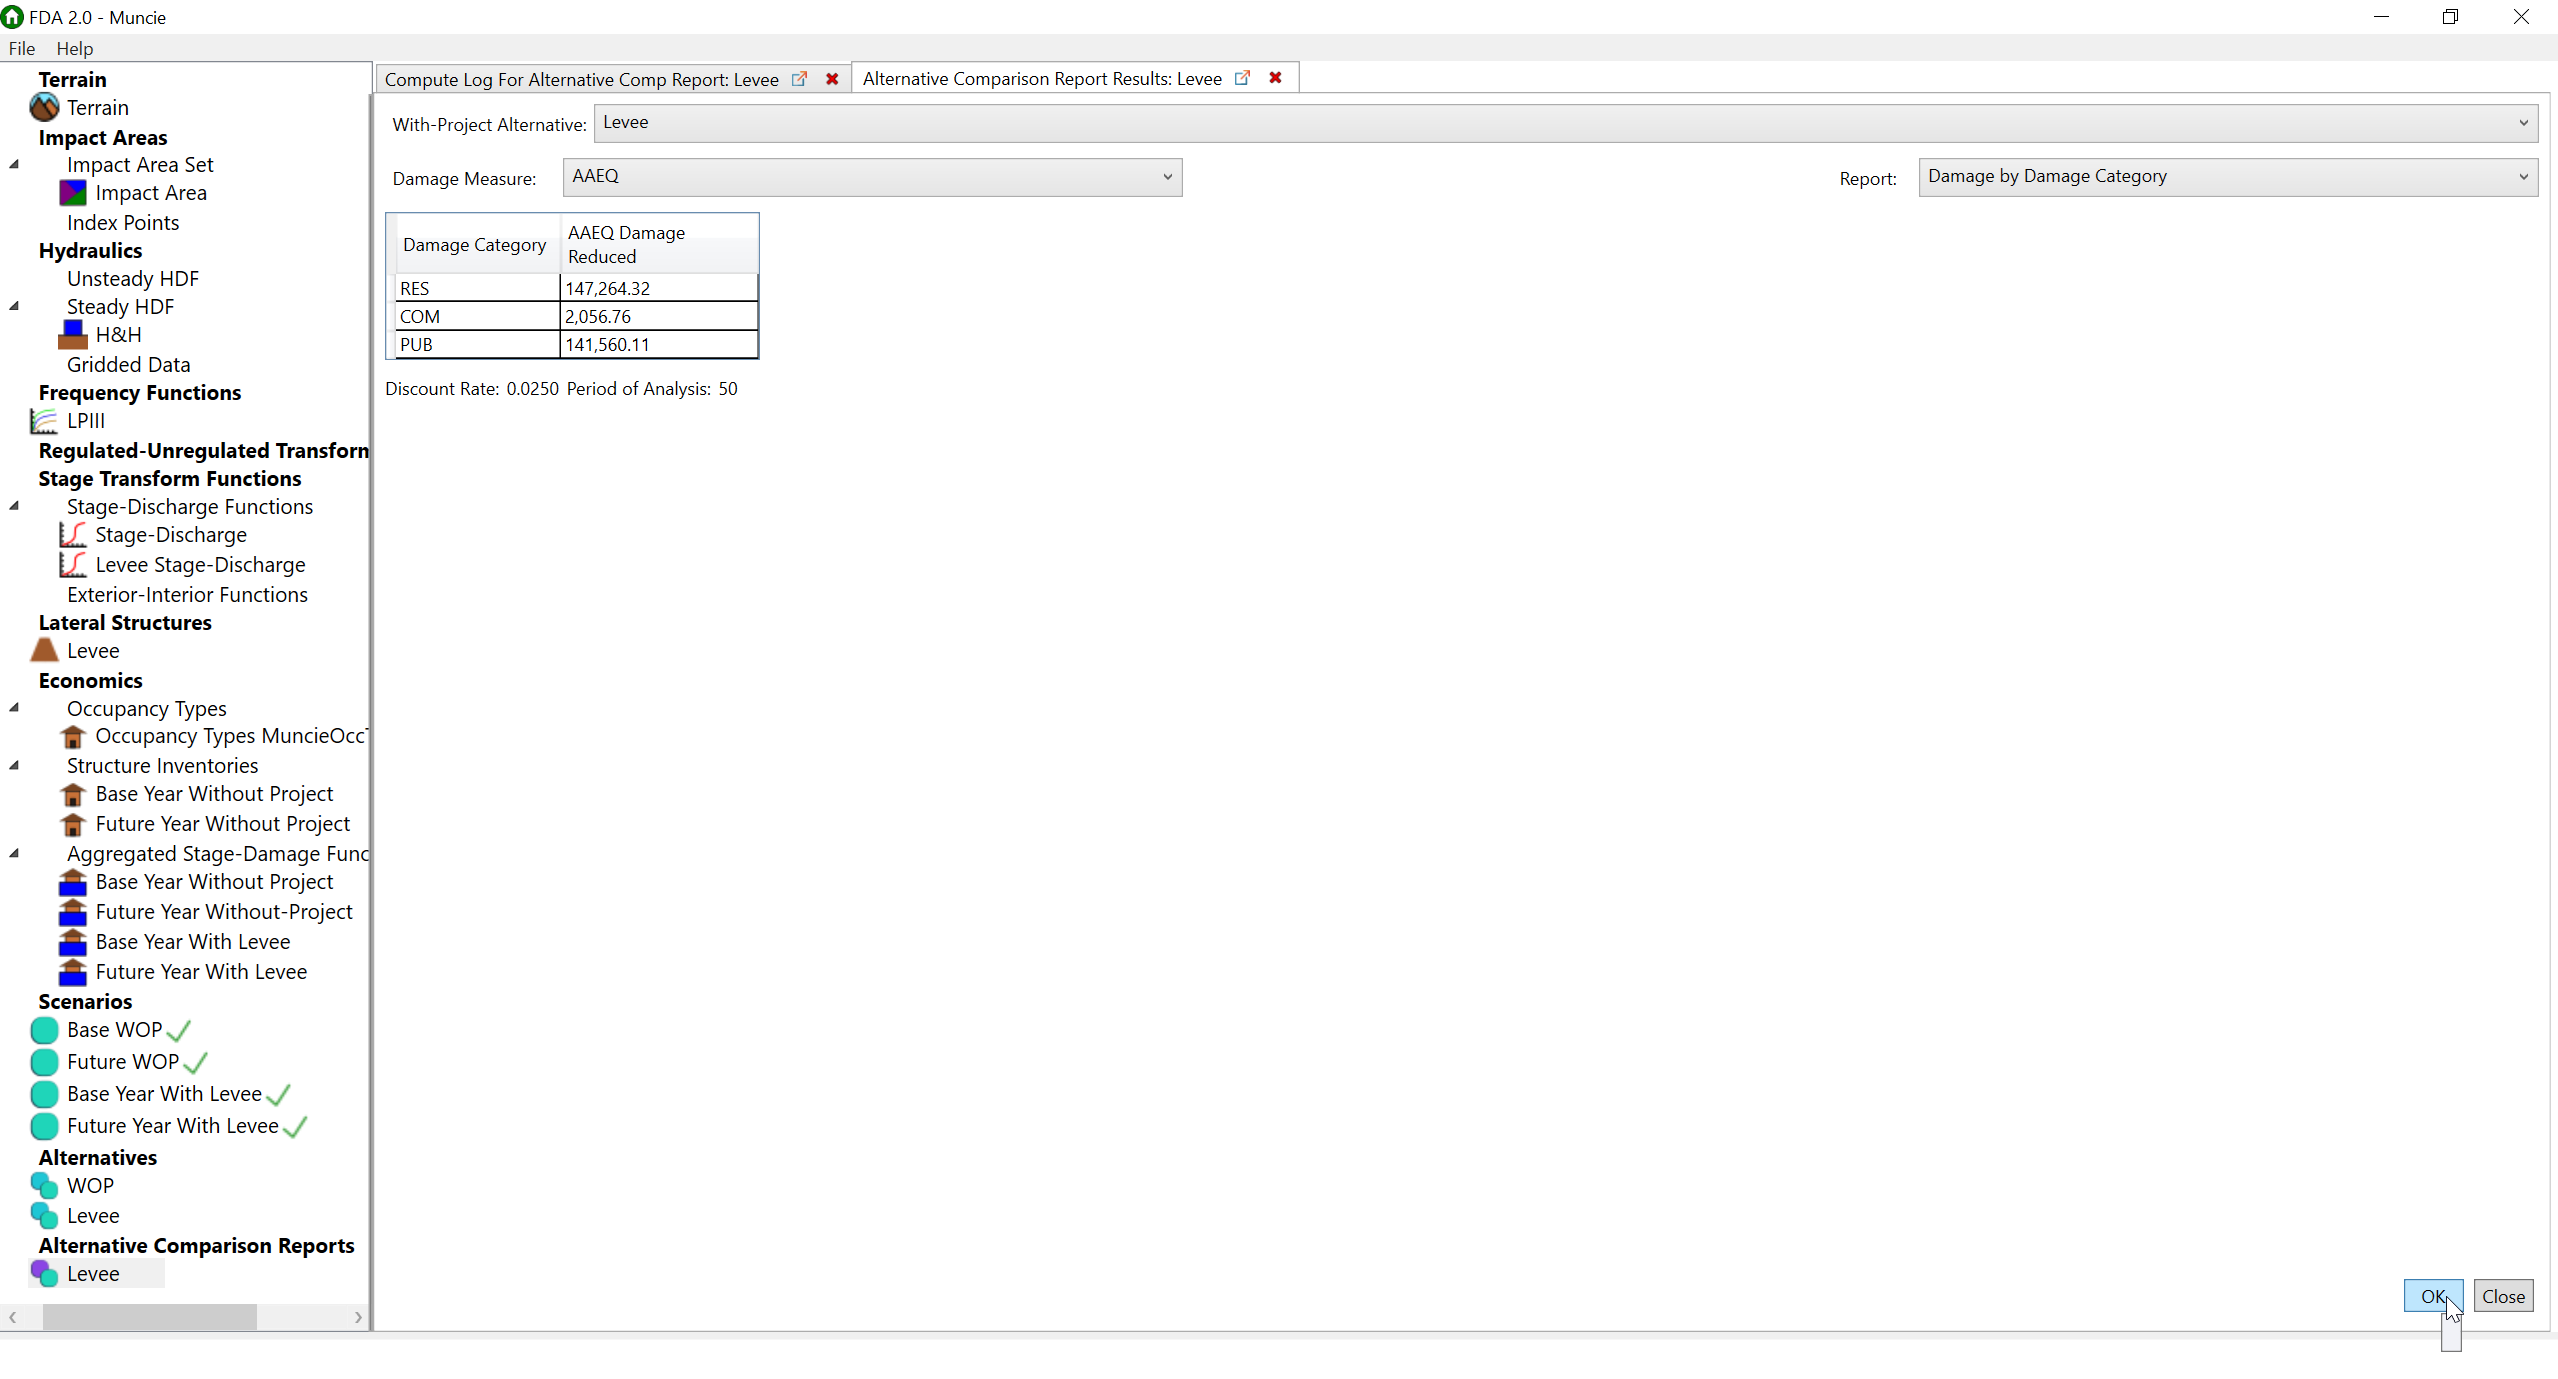
Damage by Damage Category
The damage by damage category report displays mean EqAD reduced and mean EAD reduced for each damage category, summed across all impact areas, for the selected with-project condition.
Below is a screenshot of EAD reduced across all impact areas by damage category for the base year condition. The same report can be displayed for EqAD.
Summary Report
The summary report contains 6 tables:
- Base Year Expected Annual Damage Reduced Distribution
- Future Year Expected Annual Damage Reduced Distribution
- Equivalent Annual Damage Reduced Distribution (use this for benefits)
- Base Year Expected Annual Damage Reduced by Damage and Asset Category
- Future Year Expected Annual Damage Reduced by Damage and Asset Category
- Equivalent Annual Damage Reduced by Damage and Asset Category
The following image displays the first three reports.

The next image displays a portion of the fourth report. The reports with damage and asset category detail can be long, but are helpful for QA/QC.
