Expected Annual Damage
Expected annual damage (EAD) is the average value of a probabilistic model of economic flood damage. Probabilistic models of economic flood damage are created in HEC-FDA using Scenarios.
Scenario Probabilistic Model of Damage
A probabilistic model of flood damage relates potential harm to property, infrastructure, and other assets and economic systems (all measured in monetary terms) to the likelihood of that harm occurring. The probabilistic model is based on the combination of hydrologic, hydraulic, system response, and economic summary relationships. For example, a without project scenario might involve a flow-frequency function, a probabilistic model of the annual likelihood of peak flow, a stage-discharge function, a relationship between peak flow and flood inundation, and an aggregated stage-damage function, a relationship between flood inundation and flood damage. The model of flow is used with the two relationships to derive a related probabilistic model of inundation damage; a model from which the expected (mean) annual damage is be computed.
Summary relationships are combined into a probabilistic model of damage using curve combination (also known as function or relationship composition), which is the process of combining information from at least two summary relationships to generate a new relationship. Mathematically, we can express the curve combination procedure as follows. Let q = f(p) denote discharge as a function of frequency, s = g(q) stage as a function of discharge, and d = h(s) damage as a function of stage. The objective is to produce the probabilistic model of damage by relating damage to likelihood of occurrence through a series of function compositions:
| d = h(g(f(p)). |
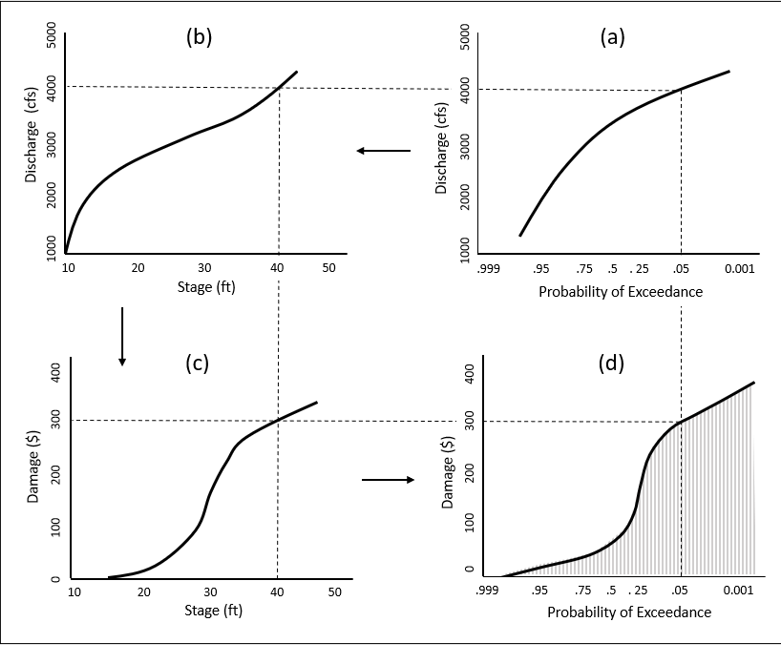
Below is an illustration of the curve combination procedure for a without-project condition that involves a flow-frequency function, a stage-flow function, and an aggregated stage-damage function. In this example for developing a probabilistic model of flood damage, no action has been taken to modify the hazard, response to the hazard, or consequences that result from the hazard. In other words, there are no dams, levees, nonstructural actions, or any other type of intervention.
Creation of the probabilistic model of damage begins in panel (a) of above figure with a probabilistic model of discharge in the form of a discharge versus frequency function. The discharge-frequency function is often obtained from a frequency analysis of the annual peak flows. In this example, the peak flow of the 0.05 AEP event is 4,000 cfs. Flood damage is principally correlated with flood stage, so the next step of the process is to translate each flow in panel (a) to a stage, using the stage-discharge relationship shown in panel (b). In the example, the peak flow of the 0.05 AEP event is 4,000 cfs and has a corresponding stage of 40 feet. Thus the 0.05 AEP event has a stage of 40 feet. Next is the relationship between flood damage and flood stage, an estimation of the consequences for each potential stage in the form of the aggregated stage-damage function shown in panel (c). In the example, the peak flow of the 0.05 AEP event is 4,000 cfs, has a stage of 40 feet, and causes damage of $300. Thus, a probabilistic model of damage based on these three relationships reflects $300 damage with an AEP of 0.05.
Each arrow of the image below reflects a curve combination used toward creation of the probabilistic model of damage relating damage to probability of occurrence. The relationship from frequency to flow to stage to damage take place for a large set of frequencies that represent the entire probability domain.
Schematic of economic risk computation (expected annual damage)
Scenario Expected Annual Damage
Once a probabilistic model of flood damage is created through a Scenarios compute, the expected value of damage, known as expected annual damage, is calculated. Expected annual damage reflects the expected value of damage in any given year, or the long-term average value of damage, but is specific to the conditions modeled of a given analysis year. Expected annual damage is defined mathematically in the equation below:
| E[X] = \int_{-\infty}^{\infty} xf_{x}(x)dx = \int_{-\infty}^{\infty} \left(1-F_{x}(x)\right)dx |
where:
X = the consequence, such as inundation damage, life loss, or emergency costs
E[X] = expected value of the consequence
x = a value of the consequence
f_{x}(x) = the probability density function of X
F_{x}(x) = the cumulative distribution function of X
F_{x}(x) = P(X \leq x) \text{ and } 1-F_{x}(x) = P(X \geq x)
The equation integrates over the complete probability domain and thus captures the complete range of damage in a single value, expected annual damage. The integration on the left is the standard definition for the mean of a function while the integration on the right allows computation of the expected value as the area beneath the cumulative distribution (with probability on the horizontal axis). Thinking about the equation as calculating a probability-weighted average consequence sheds light on the importance of more frequent consequences relative to less frequent consequences: in their contribution to the average, a very high-frequency event with very low consequences could matter as much if not more than a very low-frequency event with very high consequences. This is an important concept when considering how to reduce flood risk and which approaches will be the most economically advantageous.
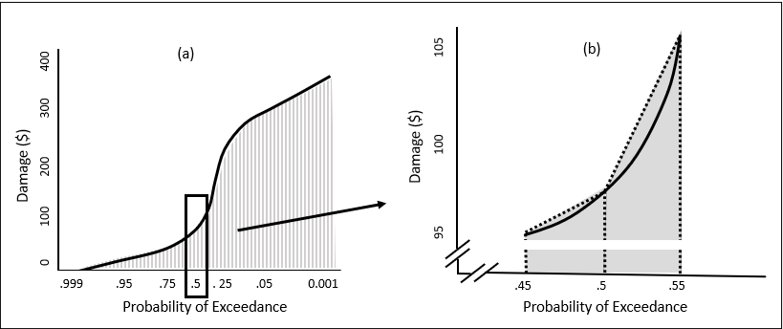
The equation above is an analytical expression of the calculation of expected annual damage. However, the majority of the relationships we use in the calculation of EAD in HEC-FDA are graphical (e.g. stage-discharge, stage-damage). As a result, we require a graphical application for the calculation of EAD. Although flow-frequency can be modeled analytically, this function is ultimately combined with graphical functions such as stage-discharge and stage-damage, so every calculation of EAD in HEC-FDA is graphical. HEC-FDA integrates graphically using the trapezoidal rule which involves calculating discrete trapezoidal areas under the curve. An example of the calculation in HEC-FDA is illustrated conceptually in panel (a) of figure below. For an interval of exceedance probability, the area under the curve is calculated as a trapezoid where the top of the trapezoid is a straight line between the two function values. This calculation is repeated on intervals of exceedance probability between 0 and 1. Navigate to this location of the HEC-FDA codebase to view the frequency intervals used. The integration operation takes place in HEC-FDA Functions. Navigate to this location of the codebase to view the integration algorithm.
Trapezoidal Rule for Frequency Curve Integration
A simple example of the graphical application of the calculation of expected annual damage is provided in the below figure and table. In the figure., an example damage-frequency function is plotted with shaded trapezoids filling the space under the curve. The table contains the corresponding EAD calculation that results from summing together the area of the trapezoids.

Example Integration of the of a damage frequency function using the trapezoidal method.
Exceedance Probability | Damage | Area Under Curve |
0.999 | 0 | |
0.9 | 0 | 0 |
0.8 | 0 | 0 |
0.7 | 0 | 0 |
0.6 | 0 | 0 |
0.5 | 0 | 0 |
0.4 | 100 | 5 |
0.3 | 400 | 25 |
0.2 | 1000 | 70 |
0.1 | 2000 | 150 |
0.001 | 2300 | 212.85 |
Sum (EAD) | 462.85 |
Example Trapezoidal Method Calculation.
Scenario Probabilistic Models of Flood Damage for With-Project Conditions
The set of summary relationships that are required in HEC-FDA to model risk with uncertainty depend on the project condition. Modeling flood risk management measures such as dams, levees, and nonstructural actions require modified or added modeling. Some examples of added or modified modeling used in Scenarios are included below.
- Channel Capacity Measures. These measures typically involve increasing the depth and/or width of a channel and decreasing channel roughness so the stage in the channel is lower for a given discharge. The change in flood risk can be captured including a modified stage-discharge function in a with-project scenario.
- Nonstructural Measures. These measures have less damage for a given flood stage. The change in flood risk can be captured by calculating stage-damage functions for a modified structure inventory and including the resulting stage-damage functions in a with-project scenario.
- Reservoir and diversions are flood risk management measures that reduce the peak stage through storage attenuation or by diverting water away from damage areas. When storage or diversion is used to alter flows, the unregulated discharge-frequency function is either replaced by a modified discharge-frequency function that reflects regulation or transformed into a regulated function by adding a regulated-unregulated transform function in a with-project scenario.
Flow Regulation Curve Combination Example
The inclusion of a regulated-unregulated transform flow function in the Scenarios analysis curve combination procedure is illustrated in the below figure. The transform function in panel (c) below represents the reservoir’s capability to reduce downstream flows (outflows from the reservoir) by storing high inflows that would otherwise cause flooding. The curve is approximately flat after inflows of about 2,000 cfs, representing storage of the inflows above that threshold. As peak inflows increase above approximately 3,500 cfs to 4,000 cfs, the retention capacity of the reservoir is exceeded, and so for larger events, outflows match inflows. The regulated-unregulated transform function, together with the unregulated discharge-frequency function, produce a regulated discharge-frequency function where the peak outflows have been reduced for a substantial range of recurrence intervals/peak inflows, as shown in panel (d). The relationship in panel (d) is then used in combination with a stage-discharge relationship and stage-damage relationship to produce a new probabilistic model of flood damage.

Levee Curve Combination Example
A levee holds water in the channel in order to reduce interior floodplain water levels across a range of water levels in a channel and as modeled in HEC-FDA as a lateral structure, ideally alongside a user-specified system response curve, default is available which assumes no failure until the top of levee. Inclusion of a levee modifies the method for assessing risk by including a step multiplying the stage-damage function by the system response curve. A system response curve is a representation of the performance of a levee and thus the performance component of risk. and takes the form of a relationship the probability of levee failure and the applied hazard (channel stage). For a given hazard loading, the system response curve is used to weight the damage that would occur should the levee fail by the associated conditional probability of failure. In other words, the stage-damage function is combined with the system response curve to develop a probability-weighted stage-damage function, as in the figure below.

Total Risk Scenarios
For scenarios with levees, damage is sometimes expected in the floodplain despite a levee measure operating successfully, which is considered non-failure damage. Damage can happen in a non-failure event if the levee is outflanked, if inundation occurs from a source separate from the leveed channel before the levee is overtopped, or if overtopping does not result in levee failure. For a total risk scenario, non-failure aggregated stage-damage functions are combined with failure stage-damage functions in the development of the probabilistic model of flood damage. The combination of damages takes place using the same multiplication of stage-damage by the system response curve, with an application of total probability theorem. The failure aggregated stage-damage functions and non-failure aggregated stage-damage functions are taken to be mutually exclusive and collectively exhaustive so that complement to the system response curve reflects non-failure, and the system response curve can be used to calculate a probability-weighted average of failure damage and non-failure damage.
Take a look at the below spreadsheet to follow along with the calculation of the total expected aggregated stage-damage function based upon the failure aggregated stage-damage functions and non-failure aggregated stage-damage functions.