One Structure No Uncertainty
Overview
The aggregated stage-damage function generated by HEC-FDA 2.0 with one structure and no uncertainty will result in an ordered pair of values; point estimates of dollar damages paired with a stage of flooding. Table 1 represents an aggregated stage-damage function for a set of stages of flooding on a structure associated with a set of dollar amounts in value lost due to flood damage to the building. As stages increase, dollar damages increase.
| Table 1. Example Aggregated Stage-Damage Function | |
| Stage (Water Surface Elevation, ft) | Dollar Damages |
| 241.53 | $ - |
| 242.13 | $ 4,500 |
| 242.73 | $ 11,321 |
| 243.33 | $ 18,143 |
| 243.93 | $ 24,964 |
| 244.53 | $ 31,786 |
| 245.13 | $ 38,607 |
| 245.73 | $ 45,429 |
| 246.33 | $ 52,250 |
| 246.93 | $ 59,071 |
| 247.53 | $ 65,893 |
| 248.13 | $ 72,714 |
| 248.73 | $ 79,536 |
| 249.33 | $ 86,357 |
| 249.93 | $ 93,179 |
| 250.53 | $ 100,000 |
The stage-damage relationship at one structure is computed by determining the water surface elevations, the depth of flooding relative to the base floor of the structure, and calculating the percent damage using depth-damage functions. HEC-FDA 2.0 utilizes georeferenced point shapefiles and georeferenced water surface profiles to determine water surface elevation at the location of a structure. The water surface elevation is then compared to the structure's foundation elevation to determine the depth of flooding. Depth-damage relationships specific to the structure type are used to determine the percent damage to the structure and other assets based on the calculated depth at the structure, which returns a dollar value in flood damages based on the estimated asset value.
This section will describe what data is required and the process by which the aggregated stage-damage function is generated.
Example Data
Structure
HEC-FDA 2.0 requires georeferenced point shapefiles. Some example structure attributes are in Table 2 below. Structure value is $100,000, which will be used to estimate the dollar damages from flooding. The residential occupancy type contains information about the depth-damage relationships. The foundation elevation, 242 ft, will be compared to water surface elevations to determine flood depth.
| Table 2. Structure 1 Key Attributes | |
| Attribute | Structure |
| Structure ID | 1 |
| Structure Value | $100,000 |
| Occupancy Type | Residential |
| Foundation Elevation (ft) | 242 |
Water Surface Profiles
HEC-FDA 2.0 requires georeferenced water surface profiles for, ideally, eight or more annual exceedance probability (AEP) events. The water surface elevations are used to determine the depth of flooding relative to the structure's base floor elevation.
The water surface elevations at the location of the structure in this example for eight AEP events are in Table 3 below.
| Table 3. Water Surface Profile at Structure 1 | ||||||||
| AEP | 0.5 | 0.2 | 0.1 | 0.04 | 0.02 | 0.1 | 0.005 | 0.002 |
| Water Surface Elevation (ft) | 241 | 242 | 243 | 245 | 246 | 248 | 249 | 250 |
Occupancy Type Data and Depth-Percent Damage Functions
Depth-damage functions are required to identify the relationship between the depth of flooding on a structure and the percent damage estimate. Depth-damage functions are defined in the Occupancy Type data, which contains other information about the structure (e.g. residential or commercial).
The depth-damage relationship for the structure and contents in this example is in Table 4 below. The content-to-structure value ratio is 100%, which means the value of the contents are 100% of the structure value in the structure inventory, which is $100,000, bringing the total asset value at the structure to $200,000.
| Table 4. Residential Occupancy Type Data | ||
| Depth | Structure Percent Damage | Contents Percent Damage |
| -1 | 0 | 0% |
| 0 | 5% | 0% |
| 1 | 10% | 5% |
| 2 | 15% | 20% |
| 3 | 20% | 25% |
| 4 | 30% | 40% |
| 5 | 60% | 75% |
| 6 | 70% | 90% |
| 7 | 90% | 100% |
| 8 | 100% | 100% |
| Content-to-Structure Value Ratio | 100% | |
With a structure, water surface profiles, and occupancy type data, an estimate of the stage-damage relationship can be computed.
Computation Steps
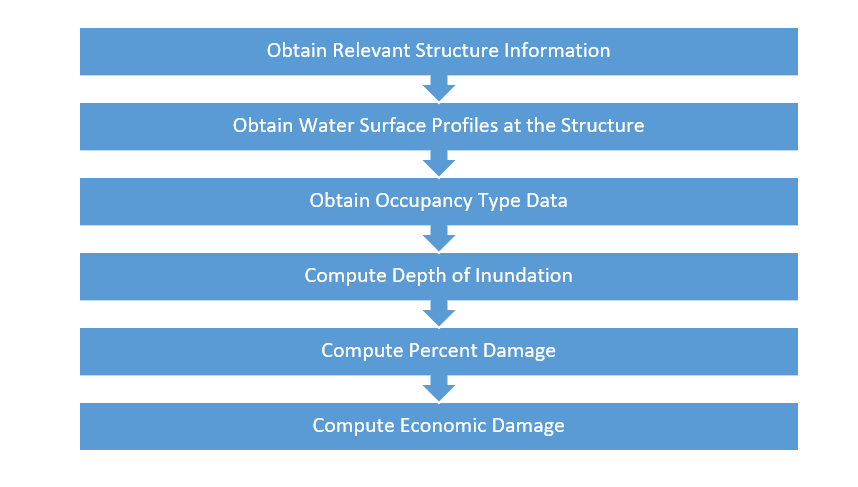
1. Obtain Relevant Structure Information
Attributes are retrieved from the structure inventory in Table 2.
2. Obtain Water Surface Profiles at the Structure
The water surface elevations at the location of the structure are assigned for each AEP event. See Table 3.
3. Obtain Occupancy Type Data
The occupancy type indicated in the structure inventory is mapped to the residential occupancy type in Table 4.
4. Compute Depth of Flooding
The water surface profiles from Step 2 are then converted to depths of flooding above the first finished floor by subtracting the water surface elevation from the structure's foundation elevation obtained in Step 1. Table 5 shows the depth on the structure for each stage.
| Table 5. Water Surface Profile at Structure 1 with Depths on Structure (ft) | ||||||||
| Stage (Water Surface Elevation) | 241 | 242 | 243 | 245 | 246 | 248 | 249 | 250 |
| Foundation Elevation | 242 | 242 | 242 | 242 | 242 | 242 | 242 | 242 |
| Depth on Structure | -1 | 0 | +1 | +3 | +4 | +6 | +7 | +8 |
5. Compute Percent Damage to the Assets
The percent damage is computed using the depth of flooding from step 3 and the depth-damage functions from Table 4. Structure and contents damages are used in this example. Other asset damages are calculated similarly.
| Table 6. Depth and Percent Damage by Stage at Structure 1 | ||||||||
| Water Surface Elevation | 241 | 242 | 243 | 245 | 246 | 248 | 249 | 250 |
| Depth on Structure | -1 | 0 | 1 | 3 | 4 | 6 | 7 | 8 |
| Structure Percent Damage | 0% | 5% | 10% | 20% | 30% | 70% | 90% | 100% |
| Contents Percent Damage | 0% | 0% | 5% | 25% | 40% | 90% | 100% | 100% |
6. Compute Asset Damages for the Range of Water Surface Elevations
The percent damages for structures and contents are then applied to the structure ($100,000) and contents ($100,000) values to determine asset damages in dollar value for the range of water surface elevations.
| Table 7. Depth and Asset Damage by Stage at Structure 1 | ||||||||
| Water Surface Elevation | 241 | 242 | 243 | 245 | 246 | 248 | 249 | 250 |
| Depth on Structure | -1 | 0 | 1 | 3 | 4 | 6 | 7 | 8 |
| Structure Percent Damage | 0% | 5% | 10% | 20% | 30% | 70% | 90% | 100% |
| Structure Damage | $0 | $5,000 | $10,000 | $20,000 | $30,000 | $70,000 | $90,000 | $100,000 |
| Contents Percent Damage | 0% | 0% | 5% | 25% | 40% | 90% | 100% | 100% |
| Contents Damage | $0 | $0 | $5,000 | $25,000 | $40,000 | $90,000 | $100,000 | $100,000 |
| Total Damage | $0 | $5,000 | $15,000 | $45,000 | $70,000 | $160,000 | $190,000 | $200,000 |
The result is a stage-damage function for one structure with no uncertainty as shown in Table 8.
| Table 8. Stage-Damage Function | |
| Stage | Damage |
| 241 | $0 |
| 242 | $5,000 |
| 243 | $15,000 |
| 245 | $45,000 |
| 246 | $70,000 |
| 248 | $160,000 |
| 249 | $190,000 |
| 250 | $200,000 |
The aggregated stage-damage function generated by HEC-FDA 2.0 includes more than eight stage ordinates, but for simplification this section and One Structure with Uncertainty will only calculate damages at the stages for the eight example water surface profiles. The calculations are otherwise as they are conducted in HEC-FDA 2.0. For more detailed information on how the stages for the aggregated stage-damage function are chosen, see Many Structures with Uncertainty.