One Structure with Uncertainty
Overview
The aggregated stage-damage function generated by HEC-FDA with one structure with uncertainty will result in a range of stages each associated with an empirical uncertainty distribution of dollar damages. Table 1 represents an aggregated stage-damage function for a set of stages of flooding on a structure associated with a set of an uncertainty distributions of dollar amounts in value lost due to flood damage to the structure. As stages increase, dollar damages increase.
| Table 1. Example Stage-Damage Function | |||
| Stage (Water Surface Elevation in ft) | 5th Percentile | Mean | 95th Percentile |
| 241.53 | $ - | $ - | $ - |
| 242.13 | $ 2,000 | $ 4,500 | $ 6,400 |
| 242.73 | $ 5,000 | $ 11,321 | $ 13,000 |
| 243.33 | $ 14,000 | $ 18,143 | $ 26,550 |
| 243.93 | $ 19,500 | $ 24,964 | $ 30,000 |
| 244.53 | $ 26,750 | $ 31,786 | $ 34,750 |
| 245.13 | $ 33,000 | $ 38,607 | $ 42,500 |
| 245.73 | $ 39,800 | $ 45,429 | $ 50,000 |
| 246.33 | $ 47,500 | $ 52,250 | $ 57,900 |
| 246.93 | $ 50,000 | $ 59,071 | $ 64,320 |
| 247.53 | $ 58,900 | $ 65,893 | $ 71,850 |
| 248.13 | $ 68,000 | $ 72,714 | $ 75,750 |
| 248.73 | $ 70,000 | $ 79,536 | $ 86,000 |
| 249.33 | $ 71,000 | $ 86,357 | $ 91,550 |
| 249.93 | $ 73,000 | $ 93,179 | $ 98,000 |
| 250.53 | $ 84,350 | $ 100,000 | $ 115,000 |
When stage-damage is computed with uncertainty, the uncertainty is defined in the occupancy type data.
The occupancy type data contains defined distributions for uncertainty around asset percent damage and structure attributes:
- Structure Percent Damage
- Content Percent Damage
- Other Percent Damage
- Structure Value
- Content Value
- Other Value
- First Floor Elevation
In this section, uncertainty around structure percent damage, structure value, and first floor elevation will be used as an example.
Example Data
Structure
Some example structure attributes are in Table 2 below. The attributes are the same as in One Structure No Uncertainty.
| Table 2. Structure 1 Key Attributes | |
| Attribute | Structure |
| Structure ID | 1 |
| Structure Value | $100,000 |
| Occupancy Type | Residential |
| Foundation Elevation (ft) | 242 |
Water Surface Profiles
The water surface elevations at the location of the structure in this example for eight AEP events are in Table 3 below. The water surface profile is the same as in One Structure No Uncertainty.
| Table 3. Water Surface Profile at Structure 1 | ||||||||
| AEP Event | 0.5 | 0.2 | 0.1 | 0.04 | 0.02 | 0.1 | 0.005 | 0.002 |
| Water Surface Elevation (ft) | 241 | 242 | 243 | 245 | 246 | 248 | 249 | 250 |
Depth-Damage Functions with Uncertainty
The depth-damage relationship with uncertainty around structure damage, structure value, and foundation elevation in this example is in Table 4 and Table 5 below. The uncertainty distributions are all defined by normal distributions.
| Table 4. Residential Occupancy Type Data | ||
| Depth | Structure Mean Percent Damage (Normal Distribution) | Structure Standard Deviation Percent Damage |
| -2 | 0% | 0% |
| -1 | 0% | 0% |
| 0 | 5% | 4% |
| 1 | 10% | 3% |
| 2 | 15% | 2% |
| 3 | 20% | 2% |
| 4 | 30% | 3% |
| 5 | 60% | 4% |
| 6 | 70% | 8% |
| 7 | 90% | 10% |
| 8 | 100% | 0% |
| 9 | 100% | 0% |
| Table 5. Structure Attribute Uncertainty | |||
Attribute | Distribution Type | Mean | Standard Deviation |
| Structure Value | Normal | $100,000 (As Entered in the Structure Inventory) | $10,000 |
| Foundation Elevation | Normal | 242ft (As Entered in the Structure Inventory) | .5ft |
With a structure, water surface profiles, and depth-damage relationship, an estimate of stage-damage with uncertainty can be computed.
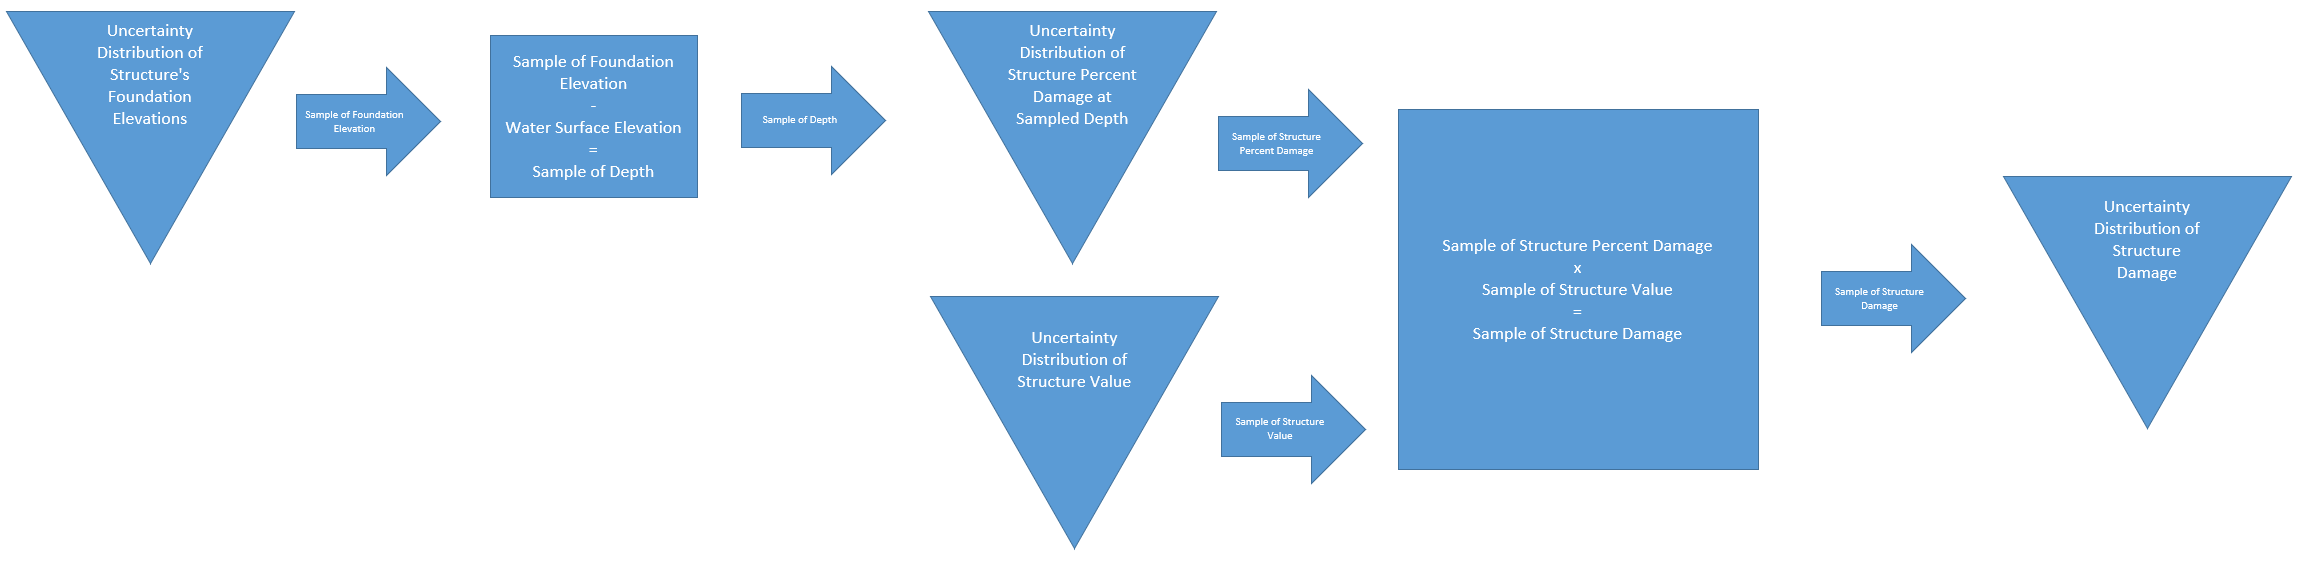
Computation Steps
HEC-FDA 2.0 generates an aggregated stage-damage function with uncertainty by Monte-Carlo simulation process. The software calculates many iterations of the damage estimates outlined in One Structure No Uncertainty to generate an empirical distribution of damages for each stage. The following steps are repeated each iteration of the Monte-Carlo process for different values of the variables according to the defined uncertainty distributions in the occupancy type data.
1. Obtain Relevant Structure Information
Attributes are retrieved from the structure inventory in Table 2.
2. Obtain Water Surface Profiles at the Structure
The water surface elevations at the location of the structure are assigned for each AEP event. See Table 3.
3. Obtain Occupancy Type Data
The occupancy type indicated in the structure inventory is mapped to the residential occupancy type in Table 4, including uncertainty around the key variables.
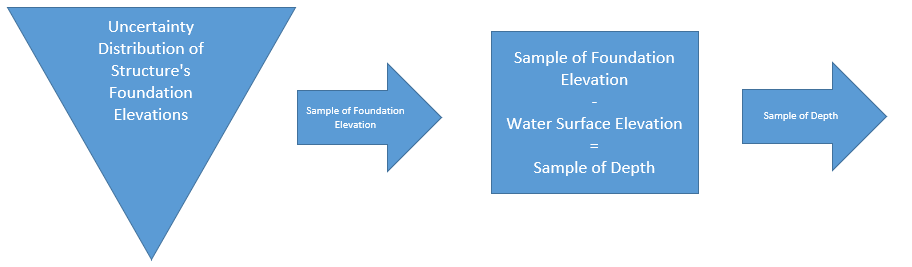
4. Compute Depth of Flooding
The water surface elevations at the location of the structure are then converted to depths of flooding. For a single iteration, a sample of foundation elevation is generated from an uncertainty distribution foundation elevation as defined in the occupancy type data. The water surface elevation is then subtracted from the foundation elevation to generate one realization of depth of flooding for each stage.
Note: water surface elevations are not sampled with uncertainty in creation of the aggregated stage-damage function. The point estimate of the water surface elevation for a given AEP at a structure is compared against the sampled foundation elevations to obtain many realizations of depth.
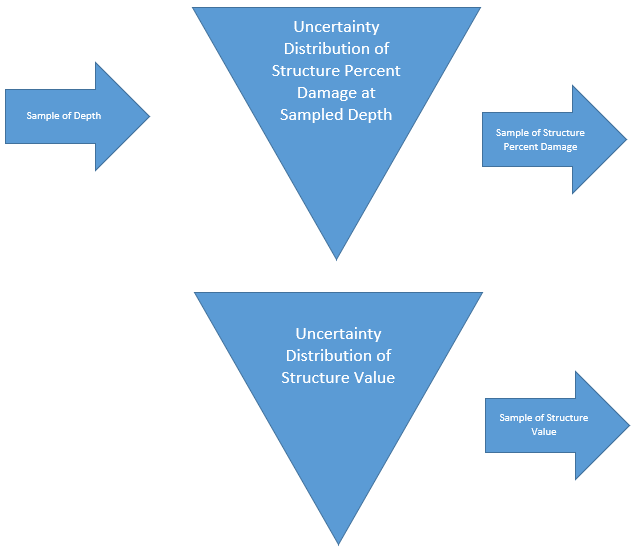
5. Compute Percent Damage with Uncertainty to the Structure, Contents, and Other
The percent damage with uncertainty is computed using the realization of depth of flooding from Step 4 and the other variables in the occupancy type data.
The sample of depth from Step 4 is matched to the stage in the depth-damage damage function in the occupancy type to return a sample of structure percent damage.
A structure value is sampled from the uncertainty distribution as defined in the occupancy type data. In this example, structure value is provided in Table 2 ($100,000) and uncertainty around structure value is defined in Table 5 (normal distribution with standard deviation of $10,000). Contents and other value are not provided in this example, but are computed similarly.
6. Compute Economic Damages with Uncertainty for the Range of Water Surface Elevations
The sample of structure percent damage is then applied to the sample of structure value to return a single iteration of dollar damages.
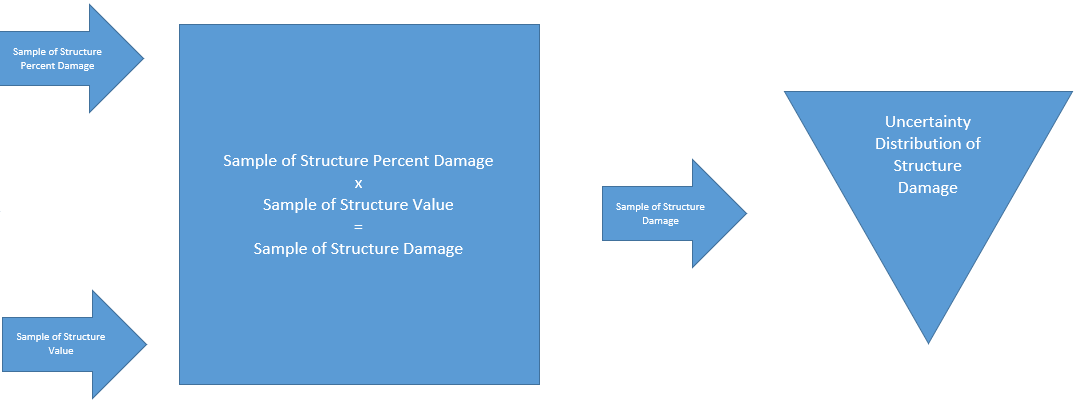
A user-defined number of iterations of this calculation will be conducted resulting in a distribution of dollar damages at each stage.
The aggregated stage-damage function generated by HEC-FDA 2.0 includes more than eight stage ordinates, but for simplification this section and One Structure with Uncertainty will only calculate damages at the stages for the eight example water surface profiles. The calculations are otherwise as they are conducted in HEC-FDA 2.0. For more detailed information on how the stages for the aggregated stage-damage function are chosen, see Many Structures with Uncertainty.