Computational Inputs (Agricultural Damage)
Computations of agricultural flood damage require a number of different inputs. Specifically, five inputs are required:
1) duration grids or DSS hydrographs (discussed in Computational Inputs)
2) National Agricultural Statistics Service (NASS) Data
3) crop budgets
4) crop values
5) Duration-Damage relationships. The duration data required to compute agricultural flood damage was discussed previously in Hydraulic Event Computation. The remaining four inputs are described in the sections below.
National Agricultural Statistics Service Data (NASS)
The NASS Cropland Data Layer is a product that represents the type of crop and the geographic location of crops throughout the entire United States (Appendix A). NASS provides the Cropland Data Layer in GeoTiff format, where each cell represents a crop type. The user can go to the following website to download, research, and pre-process NASS Cropland Data: https://www.nass.usda.gov/Research_and_Science/Cropland/SARS1a.php. HEC-FIA also allows the user to import an existing GeoTiff file with agricultural data into HEC-FIA. The distribution of each agricultural category in the study area is used in combination with the planting, harvesting, and crop loss relationships in the calculation of agricultural flood damage.
Damage to crops is dependent upon the value added by the farmer to the field at the time of flooding, and how much of that value is susceptible to flooding. The driving damage parameters are duration and the timing of the event. Similarly to structure depth-damage relationships, it is possible for crop damage to increase with longer durations. However, since crop damage is also a function of how hardy the plant is the damage for a given duration may change with time. For simplicity, the damage calculation is split into two pieces, the seasonally based value (equation below), and the seasonally based damage. A general expression of the damage calculation is as follows:
| S(t,c) = (a * (V(c,t) - H(C))) * B(t) |
where:
S = seasonally based value as a function of date and crop type
t = date
a = the area of the grid cell in acres
c = crop type
H(c) = harvest cost as a function of crop type
B = percentage of the total crop value that is available to be flooded due to the crop budget
V(c,t) = is the value as a function of crop type and date as follows:
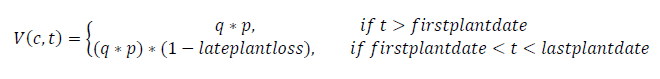
The seasonally based damage can be defined as:
| D(t,d) = S(t,c) * L(d,c) |
where:
D = damage to the crop as a function of date and duration
d = duration of flooding
L = the loss for the crop as a function of duration and crop type
To illustrate how the seasonally based value changes with time, an example plot is provided below. In the figure, the seasonally based value is expressed as a ratio of seasonal value to total value. 
Seasonal Crop Value Example
As shown in the above figure, if a crop is planted later in the season, the crop has a different value curve (e.g., red curve in the figure above). For seasonally based value changes, it is assumed that if the flood does not interrupt the farmer, the crops will be planted by the first plant date. Thus, late planting will only occur if the flood start plus the duration ends before the late plant date, but after the first plant date. This seasonally based value is intended to reflect that farmers may adopt different schedules for application of watering, fertilizer, and other processes in raising the crop; or, the farmer may choose to grow another crop altogether.
Damage can also fluctuate based on seasonality. Some crops can better withstand short duration floods if the crops are out of critical development stages. The figure below gives a general example of what seasonal duration damage relationships look like.
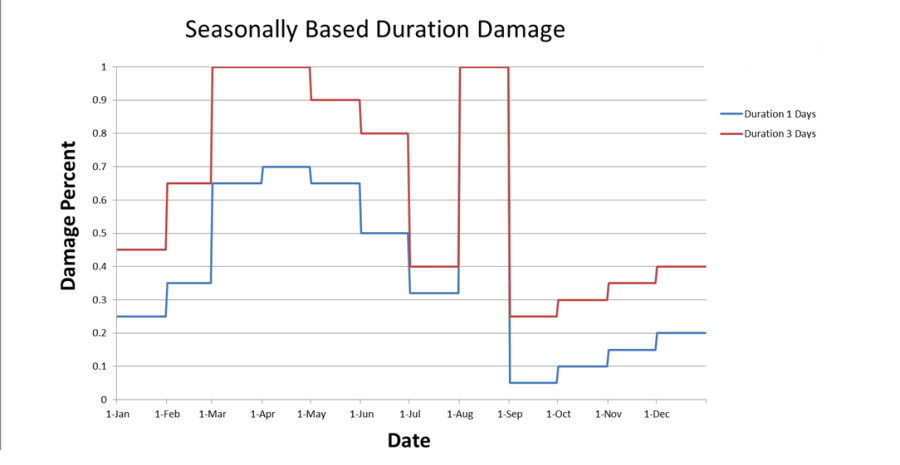
Seasonal Crop Duration Damage Example
As shown in the above figure, longer duration flooding would yield larger losses, but more mature plants would be more robust to damage. This input (planting, harvesting, and crop loss relationship inputs) is provided by the user, and must reflect their expectation of how plants will react to different durations of flooding throughout the growing season.
Crop Budget Data
Costs required to produce crops are necessary for the economic loss computations for agricultural areas. In HEC-FIA (Crop Loss Editor), crop budget data is used to define the cost of planting each crop type. Monthly crop planting costs in HEC-FIA can be either fixed or variable. The crop planting cost input data required for the economic loss computations is available from local Cooperative Extension System Offices, which can be found on the USDA's National Institute of Food and Agriculture (NIFA)'s website (Appendix A, Section A.1). The final components of the crop planting data required are the dates of the first possible and last possible plantings. The crop planting data is used to create a curve (similar to Seasonal Crop Value Example), that represents the cumulative cost of the inputs in the field at any point during the year from the first plant date.
The cumulative cost is converted to a percentage of the maximum total cost of the inputs in the field to calculate the potential losses at any point during the year. The maximum total cost input into the field is not necessarily equivalent to the total cost experienced by the farmer for the crops pulled from the field. First, the harvest cost and shipping costs need to be added to all of the inputs to get the full cost to produce the crops. HEC-FIA uses a proration of the total cost input less the harvest costs as a proxy for an exposed value.
Crop Value Data
Crop characteristics are necessary for HEC-FIA to compute the appropriate reduction in crop value due to the costs associated with harvesting. The required input characteristics are harvest date, harvest cost, yield, unit price, and percentage of total crop value lost due to late planting.
Crop Loss Relationships
Crop loss relationships are required for HEC-FIA to calculate the agricultural damage. Crop loss relationships in HEC-FIA define the percentage of crop loss based on the number of days (i.e., duration) crops are inundated each month.