Computational Inputs (Life Loss)
A number of computational inputs are required to compute life loss throughout the study area. Two of these inputs are described in Hydraulic Event Computation - structure inventory and inundation data. At a minimum, the inundation data should include depths and arrival times. Additional required inputs are Evacuation Information, Warning System Characteristics, Warning Times, and Mobilization Relationships. Lethality Rates, which are also used in the computations, are pre-defined in HEC-FIA and cannot be modified.
Evacuation Information
The evacuation information input is used to determine the amount of time required for an individual to evacuate a building and reach a safe zone. HEC-FIA determines the evacuation time necessary by referencing the spatial extents of the flood hazard area; computing the straight-line distance between the structure and nearest endpoint of the flood hazard area, and applying the user defined nominal evacuation speed. HEC-FIA determines the linear distance between a defined flood-hazard area boundary and each structure (shown in the figure below). HEC-FIA calculates a total time of evacuation from each structure using a given evacuation speed. Alternatively a pre-defined evacuation time can be entered in the model for all structures, each impact area, or on an individual structure-by-individual structure basis. The evacuation information is entered into HEC-FIA in the Alternatives Editor. 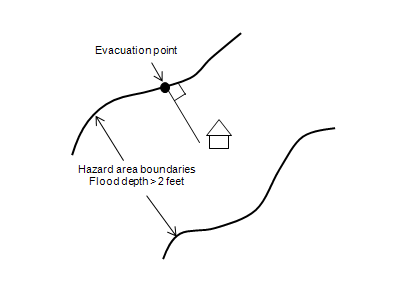
Evacuation Time Calculation Representation
Warning System Characteristics
Warning systems can be simulated in HEC-FIA to inform residents of an impending flood event in an effort to reduce or eliminate the loss of life resulting from a flood event. Six warning system setups are defined in HEC-FIA, each with a unique effectiveness over time in terms of time of day (e.g., day or night) and the activity type of the population (e.g., sleeping, working, etc.). The six warning system types are:
- sirens
- tone-alert radios
- auto-dial telephones
- Emergency Alert System (EAS)
- a combination of EAS and tone-alert radios
- a combination of EAS, sirens, and auto-dial telephones
In addition, user-defined warning systems can be created. The warning system characteristics are defined in HEC-FIA in the Impact Area Editor.
The warning system curve expresses the portion of the population warned per unit of time based on warning type, time of day, and time since warning issuance. For more information on the meaning of the parameters see Rogers and Sorensen, 1991 (Appendix A).
The rate of warning for a community is represented by the following equation:
dn/dt=k(a1*a1f(N-n)+(1-k)*(a2n(N-n))
where:
dn/dt = the change in people warned per timestep, or the rate of warning
k = the fraction of population alerted via the broadcast process
(1-k) = the fraction of the population left to be warned
a1 = the effectiveness of the warning system at broadcasting an alert
a1f = an adjustment factor that varies by time of day and activity
a2 = the effectiveness of the secondary alerting process
N = the maximum fraction that the system is designed to warn in the first thirty minutes after issuance
n = the fraction warned at the beginning of the current time step
Warning Times
The time at which the warning system is activated, must be defined in HEC-FIA. For example, in the case of a dam or levee breach, the warning system may be activated a few minutes after the breach occurs. The user must input the time of the warning relative to the simulation start time. The warning time can be specified universally for all structures or for individual warning zones. The warning times are entered into HEC-FIA in the Warning Issuance Scenario dialog.
Mobilization Relationships
Mobilization relationships define the percentage of the population that is mobilized after receiving a warning from the warning system. Three default mobilization relationships exist within HEC-FIA: 1) default (i.e., normal mobilization rate); 2) below average mobilization rate; or 3) above average mobilization rate. In addition, user-defined mobilization relationships can be created. Mobilization relationships are defined in HEC-FIA in the Impact Area Editor. An example mobilization relationship is shown in the table below, with the values in the Time column referring to the amount of time that has passed since the warning was received. For times between ordinates, the Percent Mobilized is determined by linear interpolation.
Example Mobilization Relationship
Time (min) | Percent Mobilized |
0.0 | 0.0 |
15.0 | 50.0 |
60.0 | 75.0 |
120.0 | 85.0 |
240.0 | 98.0 |
Fatality Rates
Fatality rates are used in HEC-FIA to evaluate life loss for different lethality zones (e.g., safe, compromised, or chance) where the population might be caught responding to a flood event. The following provides definitions of the three lethality zones:
- Safe Flood Zone: Represents conditions in which population is either dry or exposed to relatively quiescent floodwater or shallow flooding unlikely to sweep population off their feet.
- Compromised Flood Zone: Represents conditions in which shelters have been severely damaged by the flood, increasing the exposure of flood victims to violent floodwaters.
- Chance Flood Zone: Represents conditions in which population has no shelter from the flood, and have a chance of being rescued or finding floating debris while drifting.
A set of visuals describing the general methodology for determining lethality zones are provided for both single-story and two-story structures in the next two figures. 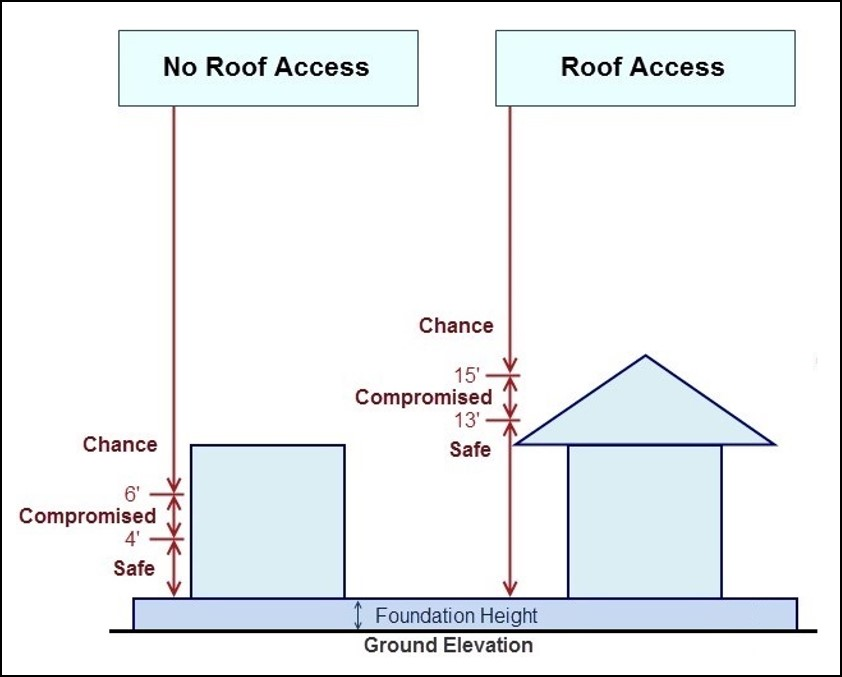
Flood Lethality Zones and Default Heights for a One-Story Structure
The table below contains the default lethality zone thresholds for each zone by occupancy type and age group.
Default Flood Lethality Zone Values by Occupancy Type and Age Group
Occupancy | Default Flood Lethality Zone Height (feet) | |||||
|---|---|---|---|---|---|---|
Under 65 | Over 65 | |||||
Safe | Compromised | Chance | Safe | Compromised | Chance | |
AGR1 | 2 or Foundation Height (FH) | 4 | 6 | 2 or Foundation Height (FH) | 4 | 6 |
COM1 | 2 or FH | 4 | 6 | 2 or FH | 4 | 6 |
COM10 | 2 or FH | 13 | 15 | 2 or FH | 13 | 15 |
COM2 | 2 or FH | 4 | 6 | 2 or FH | 4 | 6 |
COM3 | 2 or FH | 4 | 6 | 2 or FH | 4 | 6 |
COM4 | 2 or FH | 13 | 15 | 2 or FH | 13 | 15 |
COM5 | 2 or FH | 13 | 15 | 2 or FH | 13 | 15 |
COM6 | 2 or FH | 13 | 15 | 2 or FH | 13 | 15 |
COM7 | 2 or FH | 13 | 15 | 2 or FH | 13 | 15 |
COM8 | 2 or FH | 4 | 6 | 2 or FH | 4 | 6 |
COM9 | 2 or FH | 4 | 6 | 2 or FH | 4 | 6 |
EDU1 | 2 or FH | 22 | 24 | 2 or FH | 13 | 15 |
EDU2 | 2 or FH | 22 | 24 | 2 or FH | 13 | 15 |
GOV1 | 2 or FH | 4 | 6 | 2 or FH | 4 | 6 |
GOV2 | 2 or FH | 4 | 6 | 2 or FH | 4 | 6 |
IND1 | 2 or FH | 4 | 6 | 2 or FH | 4 | 6 |
IND2 | 2 or FH | 4 | 6 | 2 or FH | 4 | 6 |
IND3 | 2 or FH | 4 | 6 | 2 or FH | 4 | 6 |
IND4 | 2 or FH | 4 | 6 | 2 or FH | 4 | 6 |
IND5 | 2 or FH | 4 | 6 | 2 or FH | 4 | 6 |
IND6 | 2 or FH | 4 | 6 | 2 or FH | 4 | 6 |
REL1 | 2 or FH | 13 | 15 | 2 or FH | 4 | 6 |
RES1-1SNB | 2 or FH | 4 | 6 | 2 or FH | 4 | 6 |
RES1-1SWB | 2 or FH | 4 | 6 | 2 or FH | 4 | 6 |
RES1-2SNB | 2 or FH | 13 | 15 | 2 or FH | 13 | 15 |
RES1-2SWB | 2 or FH | 13 | 15 | 2 or FH | 13 | 15 |
RES1-3SNB | 2 or FH | 13 | 15 | 2 or FH | 4 | 6 |
RES1-3SWB | 2 or FH | 13 | 15 | 2 or FH | 4 | 6 |
RES1-SLNB | 2 or FH | 4 | 6 | 2 or FH | 4 | 6 |
RES1-SLWB | 2 or FH | 4 | 6 | 2 or FH | 4 | 6 |
RES2 | 2 or FH | 4 | 6 | 2 or FH | 4 | 6 |
RES3AI | 2 or FH | 13 | 15 | 2 or FH | 13 | 15 |
RES3BI | 2 or FH | 13 | 15 | 2 or FH | 13 | 15 |
RES3CI | 2 or FH | 13 | 15 | 2 or FH | 13 | 15 |
RES3DI | 2 or FH | 13 | 15 | 2 or FH | 13 | 15 |
RES3EI | 2 or FH | 13 | 15 | 2 or FH | 13 | 15 |
RES3FI | 2 or FH | 13 | 15 | 2 or FH | 13 | 15 |
RES4 | 2 or FH | 13 | 15 | 2 or FH | 13 | 15 |
RES5 | 2 or FH | 4 | 6 | 2 or FH | 4 | 6 |
RES6 | 2 or FH | 4 | 6 | 2 or FH | 4 | 6 |
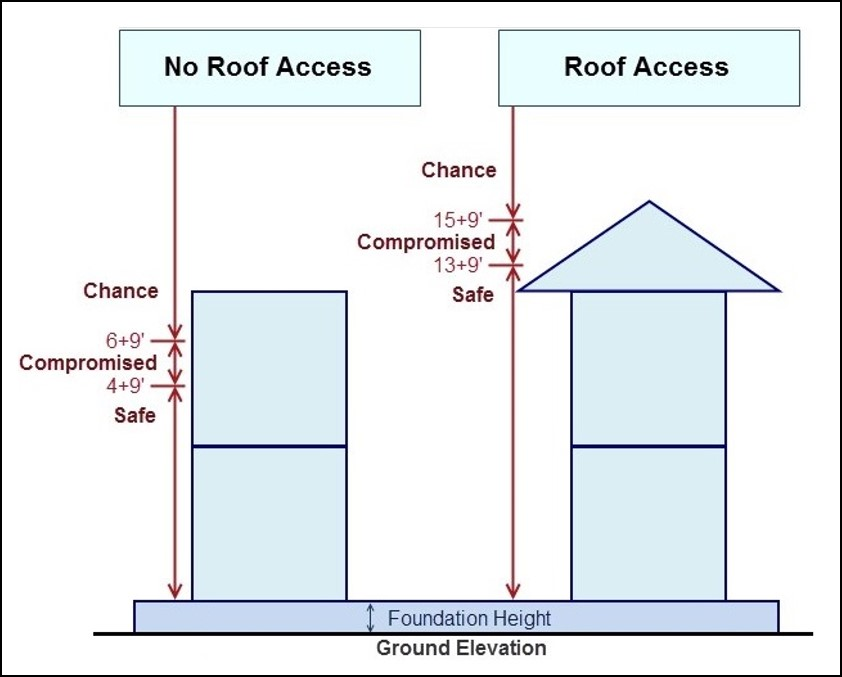
Flood Lethality Zones and Default Heights for a Two-Story Structure
The figure below displays the Safe, Compromised, and Chance flood zone empirical distributions for fatality rates 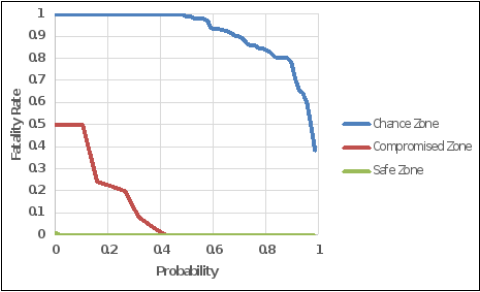
Flood Zone Empirical Distributions
When the uncertainty compute option is checked, the fatality rate distributions are sampled using the bootstrapping statistical methodology (Appendix A, Section A.2). The default average fatality rates are displayed in the table below. These rates are used when the uncertainty compute option is unchecked. The fatality rate distributions are not editable by the user, but the average fatality rates are editable. The user can change the average fatality rates to conduct a sensitivity analysis using deterministic simulations.
HEC-FIA Fatality Rates for Evacuation Outcome Categories
Evacuation Outcome | Fatality Rate | |
Cleared | zero percent | |
Caught | (percentage caught evacuating) x 0.9145 | |
Not | Safe Zone | (percentage stayed in structure) x 0.0002 |
Compromised Zone | (percentage stayed in structure) x 0.12 | |
Chance Zone | (percentage stayed in structure) x 0.9145 | |