Map Windows
Map windows are a way to graphically display stream alignments, watershed configurations, inventories, alternatives, and other HEC-FIA project elements. Depending on the project data displayed in the map window, different map window tools or other capabilities become available. For example, from an alternative map window the user can open editors and view results.
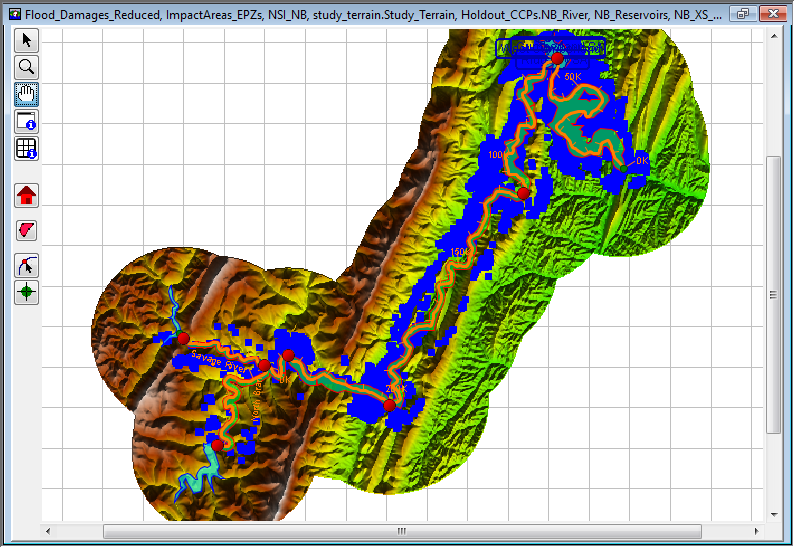
Figure: Map Window Example
Opening Map Windows
There are two ways to open map windows in the Desktop Pane. The first option is from the Study Pane, and specifically the Study Tree, double-click on a stream alignment, alternative, structure inventories or other HEC-FIA project elements. The second option is from the shortcut menu of a stream alignment, structure inventories or other HEC-FIA project elements.
To open a map window by double-clicking:
- From the Study Pane, from the Study Tree, the user can double-click on stream alignments, alternatives, structure inventories or other HEC-FIA project elements to open map windows in the Desktop Pane.
- For example, in the figure below, from the Study tab, double-click on the NSI_NB structure inventory. A map window opens displaying the structures associated with the NSI_NB structure inventory.
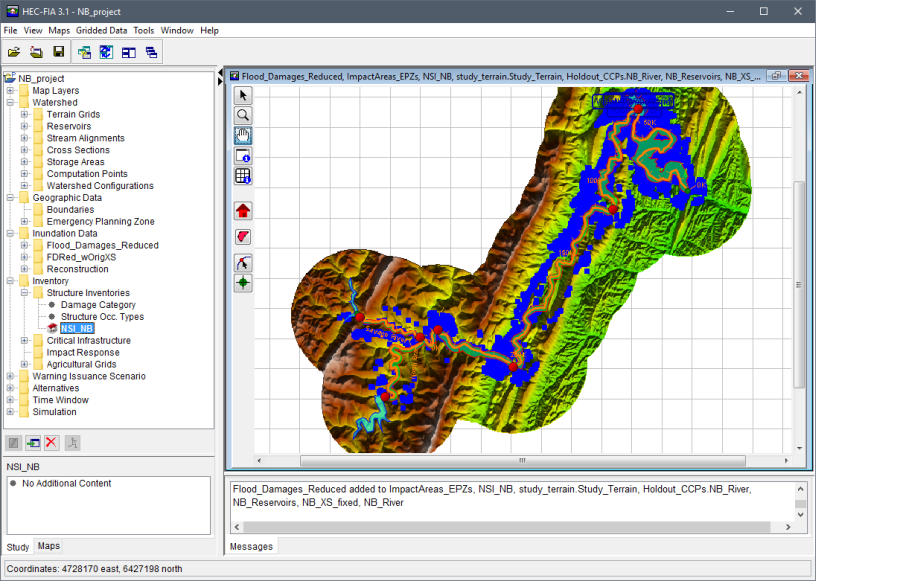
Figure: Display Structure Inventory Map Window - Study Pane
To open a map window from a shortcut menu:
From the Study tab, from the shortcut menus available for stream alignments, alternatives, structure inventories, or other HEC-FIA project elements, the Display in Map Window command displays map windows in the Desktop Pane.
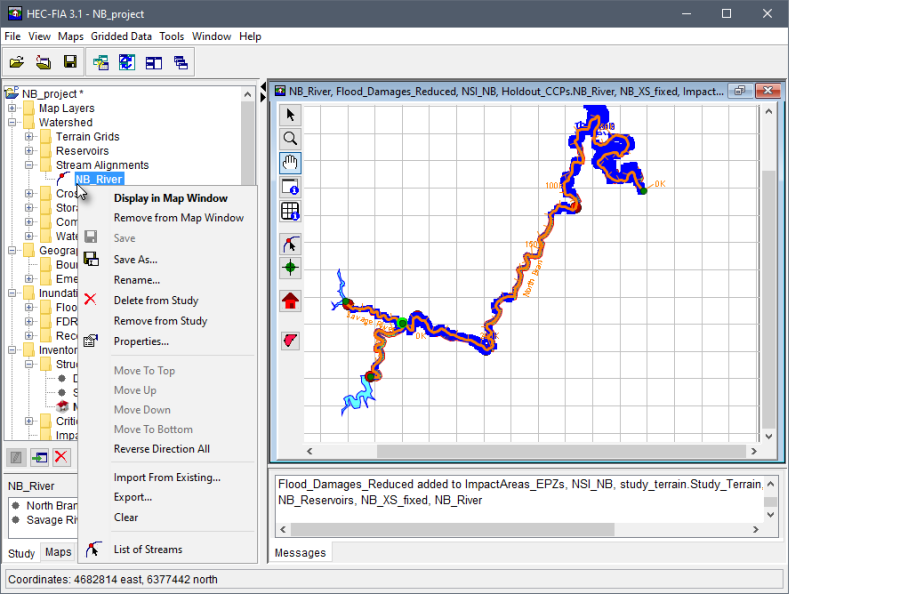
Figure: Display Stream Alignment Map Window - Shortcut Menu
- For the example in the figure above, from the Study tab, right-click on NB_River. From the shortcut menu, click Display in Map Window, a map window opens displaying the elements for the stream alignment.
New Map Window
HEC-FIA provides a mechanism for the user to build a map window. Instead of double-clicking on a stream alignment, structure inventories or other HEC-FIA project elements, the user can build a map window.
To create a map window:
From the Maps menu, click New Map Window, in the Desktop Pane a map window opens.
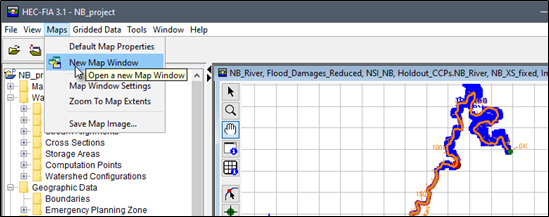
Figure: Maps Menu - New Map Window Command
- To add the elements of an HEC-FIA alternative, from the Study Tree, from the Alternatives list, double-click on an alternative (e.g., Flood_Damages_Reduced in the figure above). The elements that make up the selected alternative now display in the new map window and the map window now is an alternative map window.
- The map window is saved when the project is saved. The next time the project is opened, the map window displays as it appeared when the project was saved.
Map Window Tools
Map window tools allow the user to select structures, zoom in and out the map window, pan in the map window, get information on shapefiles and grids in the map window, and edit stream alignments. The following is an overview of available map window tools. Note, besides the primary tools (Pointer/Selector, Zoom, Pan, Shapefile Query, and Grid Query), the available map window tools vary depending on the study elements open in a map window.
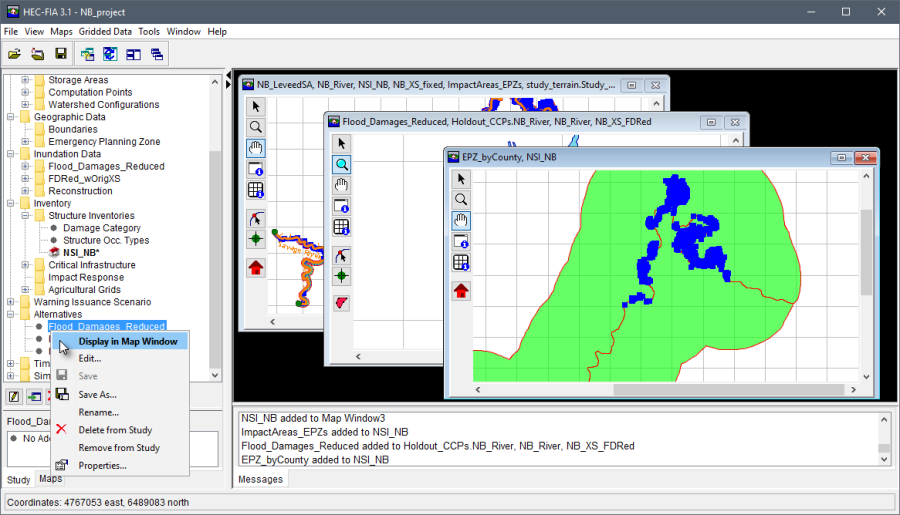
Figure: New Map Window - Alternative Added
Pointer/Selector Tool – use this primary tool to edit and delete structures. This tool can also be used to edit information contained in the displayed alternative, such as adding impact response rules to cross sections, viewing hydrographs at cross sections, editing critical infrastructure, or defining warning issuance rules. This tool is always available and always functional. |
Zoom Tool – use this primary tool to zoom in and out of the map window. This tool is selected by default. To zoom in, hold the mouse button down and outline the area that is to be zoomed in on. To zoom out, click the right mouse button (right-click). This tool is always available and always functional. |
 Pan Tool – use this primary tool to move the map window while zoomed in. This tool is always available and always functional. |
 Shapefile Query Tool – use this primary tool to query shapefile information at specific points on a shapefile. This tool is always available, but is only functional when a shapefile is uploaded to a project and displayed in the map window. |
 Grid Query Tool – use this primary tool to query gridded data. For an inundation grid, a click displays depth values. For an arrival time grid, a click displays the computed arrival time of flood waters during an event for the point at which the user clicked. For a duration grid, the values of the duration of water during a flood event for the cell are displayed where the user clicked. For a digital terrain model, the tool queries elevation values. This tool is always available, but is only functional when terrain or inundation grids have been added to a project and displayed in the map window. |
 High Ground Tool – use this watershed configuration tool to create or edit high ground polygons. This tool is only available when a watershed configuration is open in a map window. To create a high ground area, hold the CTRL key and left-click to start the polygon. Each subsequent left-click adds a vertex point. When finished, release the CTRL key and left-click on the location at the final point. |
 Stream Alignment Tool – use this tool to create or edit stream alignment elements. To create streams, with the tool selected, hold the CTRL key and left-click to start the stream. Each subsequent left-click adds vertex point to the line. When finished, release the CTRL key and left-click on the location of the final point. A Create New Stream dialog opens and users can enter the Name of the stream and a short Description (optional, but recommended). Click OK to create the stream. When an existing stream already exists in the stream alignment a Connect Stream Reaches dialog opens asking the user if the upstream end of the created stream should be connected to the existing stream. Click Yes to connect the streams. This tool is only available when a stream alignment is displayed in the map window. |
 Stream Node Tool – use this tool to add a stream node to the imported or created stream alignment. This tool is only available when a stream alignment is displayed in the map window. |
 Structure Tool – use this tool to copy, delete, edit, and get information for an individual structure. This tool is only available when a structure inventory is displayed in the map window. |


Using Shortcut Menus
Using the previously described Map Window Tools, users can edit the project elements displayed in the window using shortcut menus. For example, when users engage the Structure Tool, they can locate an individual structure they wish to edit, right-click, and perform a variety of actions from a shortcut menu, as shown in the figure below.
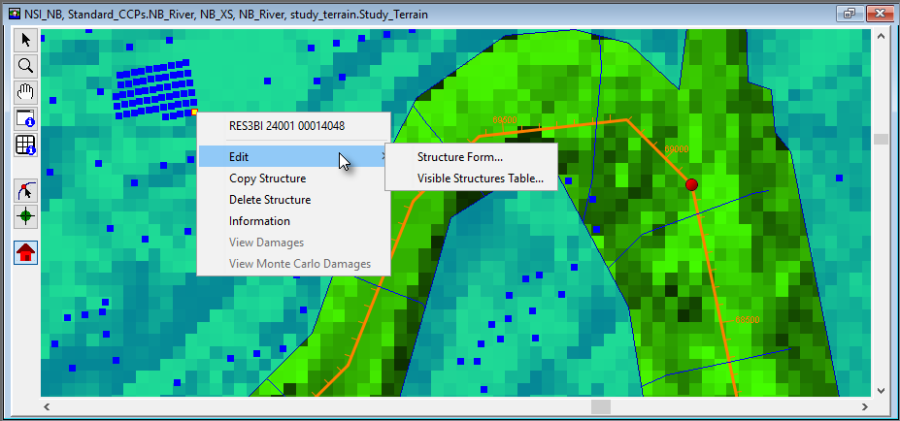
Figure: Map Window - Structure Shortcut Menu Commands
The shortcut menu makes creating and editing projects in HEC-FIA efficient and intuitive. The editing capabilities for different project elements and data are described in their respective chapters of this manual.
Properties of a Map Window
The basic properties of a map window are the geographic extents, zoom factor, available map layers, grid, and background color. From the Maps menu, click Maps Window Settings, the Map Window Settings dialog box displays. This dialog box provides information about the current map window that is open and selected (active in the Desktop Pane). The user can toggle on/off map layers; toggle on/off the grid in the map window; and, the user can change the background color of the map window.
To edit and view the active map window's properties:
- From the Maps menu, click Map Window Settings, the Map Window Settings dialog box opens.
From the Current View Extents box, the user can view the extents of the map window and the current zoom factor.
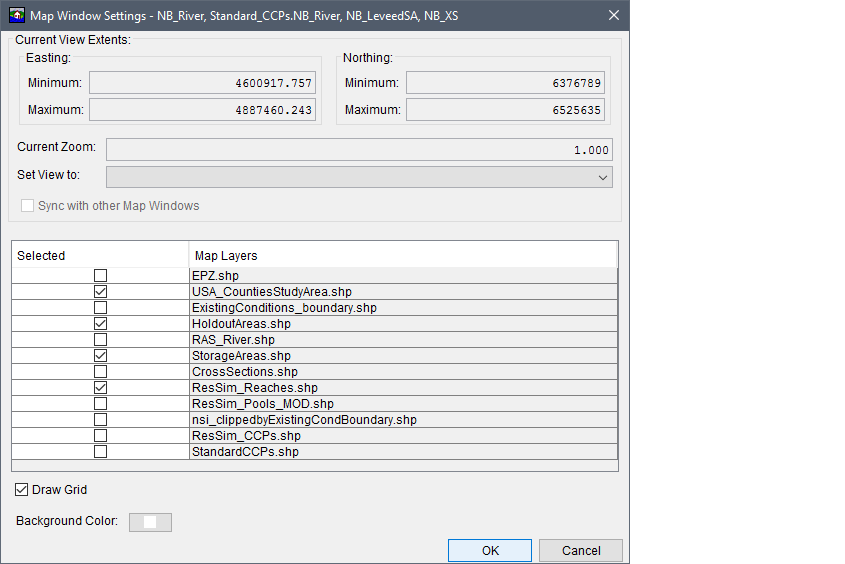
Figure: Map Window Settings - Active Map Window - Example
- The map layers associated with the active map window are listed in the table on the Map Window Settings dialog box. The user can remove a map layer from the active map window by clicking to uncheck the checkbox for the layer in the Selected column. For example, in the figure above, if user does not want to display the map layer associated with the HEC-ResSim holdout areas, click to clear the checkbox
 in the Selected column associated with HoldoutAreas.shp. Click OK, the Map Windows Settings dialog box closes, and the map layer no longer displays in the active map window.
 - By clicking Draw Grid, the user can turn on (selected by default) and off the grid that is displayed in the active map window.
The default background color for the active map window is white, by clicking Background Color; a Color Chooser dialog box opens. From the Swatches tab click on a color, click OK, the Color Chooser dialog box closes. See Appendix F for further details on the color chooser. From the Map Windows Setting dialog box, click OK. The Map Windows Setting dialog box closes and the background color of the active map window changes.
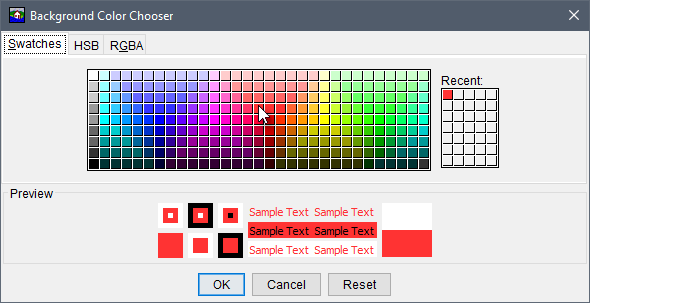
Figure: Background Color Chooser - Example Recent Selection
Saving a Map Window to a Graphics File
HEC-FIA allows the user to save the active map window to a graphics file for inclusion in reports and presentations. HEC-FIA has three possible formats: Windows Metafile (.wmf; default), JPEG (.jpg, .jpeg) and Portable Network Graphics (.png).
To create a graphics file of the active map window:
- From the Maps menu, click Save Map Image, the Save Browser opens.
Browse to the location where the file is to be saved, in the File name box type a name. From the Files of type list select the graphics file type (i.e., Windows Metafile - .wmf; JPEG - .jpg, .jpeg; Portable Network Graphics - .png) that is to be created.
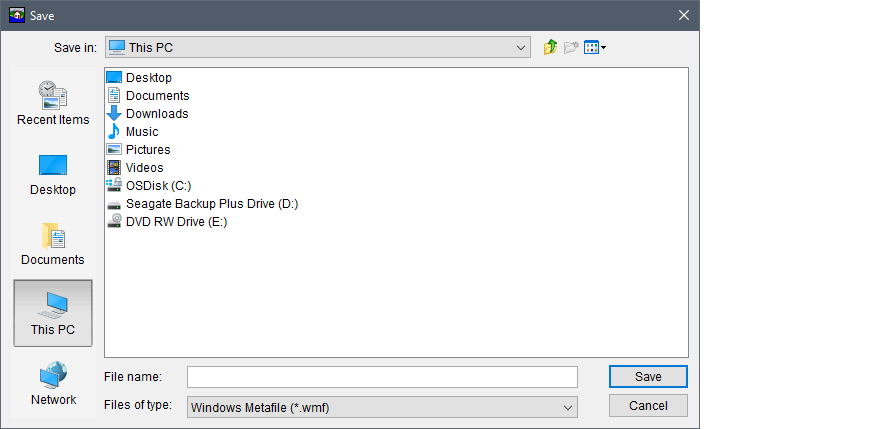
Figure: Save Browser - Save Map Window to Graphics File
- Click Save, the Save Browser closes, and a file with the appropriate extension is created in the selected location. The file contains an image of the active map window.