Preparing Digital Terrain Model in HEC-RAS
Terrain data can be in binary grid format, or in the tiled image format (*.tif) for use in HEC-FIA. The tiled image format is the suggested file type in HEC-FIA. HEC-FIA converts the file to .tif if it is not already in that format. HEC-RAS also uses the .tif format, so if the HEC-RAS model has a terrain, the user should use the terrain in .tif format as created by HEC-RAS. Terrain information is required to assign ground elevations to a structure inventory generated in HEC-FIA or to update ground elevations in an existing structure inventory. To prepare a terrain grid through RAS Mapper, follow the steps below:
- Open RAS Mapper.
- The node at the bottom of the map tree is titled "Terrains", and should have a sub node which represents the terrain for the RAS Mapper Project.
It is possible for there to be many terrains in the RAS Mapper project. To make sure that the proper terrain is being used, the user should check which terrain is associated with the geometry that is producing the results being provided to HEC-FIA. To do this, right-click on the appropriate Geometry in the Results Node of the Map tree, and select Associate Terrain Layer. The Manage Geometry Associations dialog box opens and the user should be able to identify the terrain for the results in question in the third column of the form.
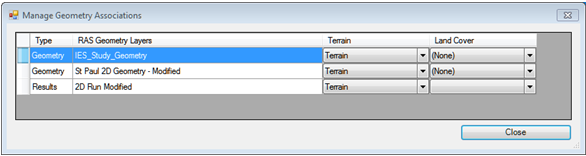
Figure: Manage Geometry Associations Dialog Box
- Now that the name of the terrain file is known, go to the root directory of the HEC-RAS project directory, and find a terrain titled "Terrain.tif", or "Terrain.vrt". A terrain grid can be represented by more than one "Terrain.tif", or "Terrain.vrt".
To check a .vrt file, open the file in a text editor, there is an xml node <ComplexSource> which contains at least one xml node <SourceFilename>. The file path in the SourceFilename is the path to the data file for the terrain .vrt, The path is relative to the .vrt file. If there are many files, make sure to grab all of the referenced files and the .vrt file to send to the HEC-FIA modeler. HEC-FIA can import .vrt files as well.

Figure: Editing the XML File Associated with a .vrt File
Creating Gridded Output
Flood inundation information for a specific flood scenario is supplied to HEC-FIA in the form of depth grids, when the consequence assessment uses gridded data. Depth grids used for the assessment are typically generated by a hydraulic engineer using RAS Mapper. The typical output format is a GeoTif *.tif for HEC-RAS 5.0 with RAS Mapper. This section describes how to output data to grids. The procedure works for unsteady one-dimensional hydraulics modeling, modeling with two-dimensional flow areas, or plans with combinations of both.
HEC-FIA uses two main grids, the maximum depth grid, and the arrival time grid. The maximum depth grid describes the highest depth in a grid cell throughout the entire simulation. The arrival time grid defines when a grid cell had depth that exceeds some user defined threshold. HEC-FIA can also use a duration grid for agriculture computations describing how long a grid cell is wet, starting with the first time the threshold is crossed on the rising limb, until the last time the threshold is exceeded on the falling limb.
To create a stored grid in RAS Mapper:
- From the RAS Mapper main window, from the Tools menu, click Manage Map Results.
The Manage Results Maps dialog box opens. From the table, click Add New Map, the Results Map Parameters dialog box opens.

Figure: Manage Results Maps Dialog Box
To create a maximum depth grid, from the Map Type list box, select depth. From the Unsteady Profile box, select Maximum. From the Map Output Mode box, select Stored Raster (using current terrain as layout). To create a maximum depth grid, click Create this map.

Figure: Results Map Parameters Dialog Box
The Manage Results Maps dialog box (Figure G.9); now has an added row for the maximum depth grid that was just created. From the Store Status column, the status for the maximum depth grid is Map not created yet. To actually write the file to disk, click Compute/Update Stored Maps, status is now Map files up to date.

Figure: New Maximum Depth Grid
- To add an arrival time grid, from the Manage Results Maps dialog box, click Add New Map, the Results Map Parameters dialog box opens.
- From the Map Type list, select arrival time, from the Unsteady Profile box, select Hours. HEC-FIA expects the arrival time grid to be in decimal hours not decimal days.
- If the arrival time grid being created includes loss of life, from the Depth Threshold Parameters box in the Threshold depth box enter a value if the study team decides this is an important threshold to evaluate (sensitivity). When creating any arrival time grid, it is important to communicate the start time of the arrival time grid to HEC-FIA.

Figure: Depth Threshold Parameters
If an agriculture arrival time grid is being created, the Threshold depth needs to be reviewed by the PDT, which hopefully includes an economist. Once the PDT has come to an agreement on the parameters for the arrival time grid, from the Map Output Mode box, click Stored Raster (using current terrain as layout). From the Results Map Parameters dialog box (Figure G.10) click Create this Map, and the arrival time grid has been created.
- From the Manage Results Maps dialog box, on the table a row has been added for the arrival time grid that was just created. From the Store Status column, the status for the arrival time grid is Map not created yet. To actually write the file to disk, click Compute/Update Stored Maps, status is now Map files up to date.
- Commonly in dam failure studies, depth and velocity grids are important for life loss analysis. Depth and velocity grids are used by HEC-FIA to compute building stability criteria, and can have large impacts on the life loss computes. To create a depth and velocity grid, from the Results Map Parameters dialog box, from the Map Type list, select depth and velocity. From the Unsteady Profile box, the default is Maximum. From the Map Output Mode box, select Stored Raster (using current terrain as layout).
- To create the depth and velocity grid, from the Results Map Parameters dialog box click Create this Map, and the depth and velocity grid has been created.
- From the Manage Results Maps dialog box, on the table a row has been added for the depth and velocity grid that was just created. From the Store Status column, the status for the depth and velocity grid is Map not created yet. To actually write the file to disk, click Compute/Update Stored Maps, status is now Map files up to date.
- Finally, for duration grids, from the Results Map Parameters dialog box, from the Map Type list, select duration.
- From the Unsteady Profile box select Hours. From the Depth Threshold Parameters box in the Threshold depth box enter 0 (zero). From the Map Output Mode box select Stored Raster (using current terrain as layout).
- To create the duration grid, from the Results Map Parameters dialog box click Create this Map, and the duration grid has been created.
- From the Manage Results Maps dialog box, on the table a row has been added for the duration grid that was just created. From the Store Status column, the status for the duration grid is Map not created yet. To actually write the file to disk, click Compute/Update Stored Maps, status is now Map files up to date.
For more information on these grids and how they are created, consult the documentation for HEC-RAS.
HEC-DSS File
HEC-FIA obtains flood wave arrival times for individual structures for life loss computations from stage-hydrographs stored by HEC-RAS in a HEC-DSS (Hydrologic Engineering Center's Data Storage System) file. For this information to be useful to HEC-FIA, the hydraulic engineer must configure HEC-RAS to generate stage-hydrographs at all cross section and storage area locations before simulating an event. Since HEC-FIA interpolates the stage between cross sections, and minutely information is important, it is advised that the output time step be set to a relatively small time step. Typically fifteen- to five-minutes are used.
- From the main HEC-RAS window.
- Click Unsteady Flow Analysis, the Unsteady Flow Analysis dialog box opens.

Figure: Unsteady Flow Analysis Dialog Box
From the Options menu, click Stage and Flow Output Locations, the Stage and Flow Output Locations dialog box opens

Figure: Options Menu - Stage and Flow Out Locations

Figure: Stage and Flow Output Locations Selector
- From the River list, select (All Rivers).
- From the RS box, select (All Rivers).
- Click the right-arrow button to select all the cross section locations to the Selected Locations box.
- Click OK; the Stage and Flow Output Locations dialog box closes.
- From the Unsteady Flow Analysis dialog box, in the HEC-DSS Output Filename box, enter the path and the filename of the HEC-DSS file that contains the stage-hydrographs created by HEC-RAS.
- Click Compute, the Unsteady Flow Analysis dialog box closes, and the HEC-RAS Computations dialog box opens. When computations are finished, click Close, the HEC-RAS Computations dialog box closes.
- The HEC-DSS file is created during the HEC-RAS simulation in the location that the user selected.