Download PDF
Download page Case Study: Flood Forecasting in the Kaskaskia Watershed.
Case Study: Flood Forecasting in the Kaskaskia Watershed
Watershed Description
The Kaskaskia River watershed is located in central Illinois with headwaters near Champaign, Illinois and the outlet to the Mississippi River just upstream of Chester, Illinois. The watershed is approximately 5,790 square miles in total drainage area. Two reservoirs are operated by USACE on the Kaskaskia, Lake Shelbyville and Carlyle Lake. Several other smaller reservoirs that are not operated by USACE were not included in the Kaskaskia HEC-HMS model. The total drainage area upstream of Shelbyville Dam is 1,054 square miles, and total area draining to Carlyle Dam is 1,663 square miles. The Kaskaskia Lock and Dam is located just upstream of the outlet and provides a minimum depth for navigation. The Kaskaskia River watershed, including the location of dams and tributaries, is shown in the following figure. Slopes in the watershed are typically gentle, except for a few portions of steeper slopes. Soil types vary throughout the watershed, but, generally, the upper portions are composed of soils with higher infiltration rates, while middle and lower portions are composed of soils with lower infiltration rates (USACE, 2013).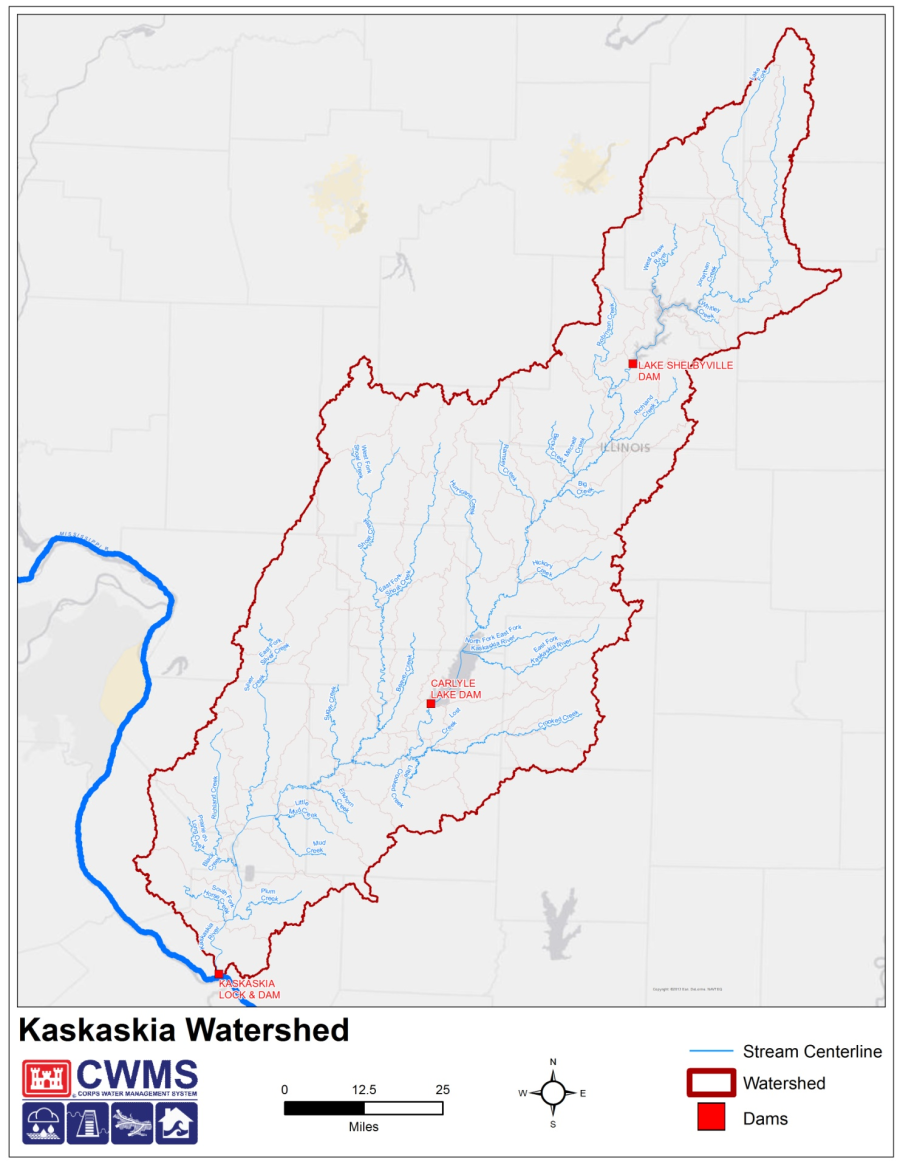
Required Decisions
For the development of an HEC-HMS model to be applied to flood forecasting, the following questions must be answered:
- What is the appropriate level of subbasin delineation for a forecast model? (Typically, a flow forecast will need to be completed in a timely manner and a complex or detailed model is not required to determine adequate results.)
- What are the appropriate modeling methods for a forecast model? (Some locations will need a continuous simulation model where evapotranspiration and soil moisture need to be included in the model. In addition, previous studies or regional preferences for specific modeling methods can help determine which modeling methods to select).
- Which calibration events should be chosen to give an adequate range of parameter values? (Select as many calibration, and validation, events as possible to build multiple parameter sets that could be used for dry, average, wet, and seasonal conditions.)
Once a model has been created and calibrated to historic events, the forecast alternative compute type must be configured before the forecast alternative can be used for efficient forecast simulations. The following question must be answered when configuring the forecast alternative:
- How should zones be defined for subbasins or reaches? (Zones should be defined in a way to expedite calibrating the model in real-time. Grouping subbasins and reaches into zones of homogenous watershed characteristics, or by elements within major tributaries or upstream of an observed flow gage could be helpful.)
Once a forecast model has been created, the modeler must run a forecast. To achieve the most accurate forecast results, the following questions must be answered:
- What are the current watershed conditions? Which basin model should be used in the forecast alternative configuration? (Understanding the state of the watershed at the beginning of the forecast simulation will help identify which parameter set to use. Some additional model calibration will be necessary, but starting with the right parameter set will reduce the amount of time needed to develop a well calibrated model.)
- What are the appropriate values with which to initialize the model baseflow and reservoir stage? (Observed information should be used to the extent possible to initialize baseflow and reservoir stage.)
- How should zonal adjustments be used to calibrate the model? (Zonal adjustments should be used to adjust the base model's parameter set so the model can reproduce the observed flow within the look back period. Once the model is calibrated, it can be used to predict precipitation-runoff in the forecast period.)
Required Information
To answer the questions above, the forecaster will use an HEC-HMS model to compute the flood hydrograph for the different watershed conditions. To develop an HEC-HMS model, the following information is required:
- Basin data: Soil types and infiltration rates, land use characteristics and percent impervious, physical geometry including lengths and slopes, local precipitation patterns, drainage patterns, channel geometry and conditions.
- Reservoir and stream gage locations and watershed characteristics are considered for subbasin delineation. Flows at forecast locations are required for a flood forecast model.
- Physical characteristics for reservoirs, such as elevation-storage curves, outlet dimensions, etc.
- Observed precipitation and flow data for a range of calibration events.
- A reasonable range of model parameters should be developed by synthesizing calibration results.
For flood forecasting,
- Future meteorologic conditions, precipitation (QPF) and temperature, for the forecast period.
- Understanding of other models and their data needs (reservoir simulation, hydraulic, and consequence models will use flow forecasting results from HEC-HMS), as well as the data needs of emergency management and the reservoir regulators.
For the Kaskaskia basin model, the information required was found using national databases, such as the Gridded Soil Survey Geographic (gSSURGO) Database from the NRCS, data records from gages obtained through the Geostationary Operational Environmental Satellites (GOES) networks and other national data sources, existing models, and regional studies.
Spatial and Temporal Extent
The study area has been defined as the Kaskaskia River watershed. The next step in model development is to divide the study area into subbasins. If a detailed DEM is available, GIS tools within HEC-HMS can be used to delineate the subbasins, establish the flow paths, and calculate physical parameters of the watershed (such as length, centroid location, and average slope). However, if a high-resolution DEM is lacking, additional information, like published stream and subbasin boundaries, can be used to improve the GIS based delineation. For the Kaskaskia watershed, a 10-meter DEM was available from the USGS NED as well as LiDAR grids for some counties within the basin. The subbasin delineation from the 10-meter DEM was verified against published drainage areas, at gage locations, and published delineations from the National Hydrography Dataset. Because gage data from historical events were available, subbasins were delineated such that outlet points were at existing stream gages where possible. These data were used in the calibration of the subbasins in the watershed model.
The temporal resolution of the model also needs to be selected. Some methods in the basin model have parameters that are sensitive to time interval, so those parameters have to be estimated with the knowledge of what the time interval will be when the model is run. The forecaster must ensure the peak of the hydrograph is adequately captured when selecting a time step. For the Kaskaskia watershed, a time interval of one-hour was selected.
Model Method Selection
Creating the Kaskaskia River HEC-HMS model included selecting modeling methods for rainfall loss, runoff transform, baseflow, and channel routing. Modeling method selection is often made based on familiarity of the modeling method, availability of existing models to aid in model parameterization, and whether the modeling method is appropriate for the intended application. Modeling methods and applicable starting parameter estimates are described below.
- Rainfall loss - The deficit and constant loss method was selected. The deficit and constant loss method is one of two loss methods that are appropriate for continuous simulation (the deficit and constant and soil moisture accounting loss methods simulate wetting and drying of the soil due to evapotranspiration). Two watershed conditions, wet/typical and dry, were modeled for the Kaskaskia basin. The initial deficit starting value was estimated as half the available water storage for the wet/typical condition and equal to the available water storage for the dry condition.
- Runoff transform - The Modified Clark method was selected to model runoff transform. The Modified Clark method utilizes the spatial variability contained within gridded radar rainfall (the other transform methods require gridded precipitation to be averaged over the subbasin). The Modified Clark method requires time of concentration and storage coefficient parameters. The TR-55 method was used to determine a starting value for time of concentration. The storage coefficient was estimated based on previous models of the Kaskaskia.
- Baseflow - The recession method was used to model baseflow. Parameters used to model baseflow were estimated using available gage data, historic flow records, and engineering judgement.
- Channel Routing - A combination of Modified Puls and Muskingum channel routing methods were selected. An HEC-RAS model was available to develop the storage-discharge curves needed for the reaches using the Modified Puls routing method. Initial parameter estimates for the reaches using the Muskingum routing method were estimated using channel properties.
Model Calibration and Verification to Historic Flood Events
Kaskaskia model calibration includes adjusting parameters associated with the described modeling methods. The model was calibrated to multiple watershed conditions, wet/typical, wet/snowmelt, and dry. During model calibration, the modeler adjusted the following parameters based on the selected modeling methods.
- Initial and maximum deficit and constant loss rate for the deficit and constant rainfall loss method.
- Time of concentration and storage coefficient for the ModClark runoff transform.
- Initial discharge, recession constant, and ratio to peak parameters for the recession baseflow method.
- Number of subreaches for the Modified Puls and Muskingum channel routing methods, and the Muskingum K and X parameters.
Model parameters were adjusted to improve the simulated flow as compared to observed flow hydrographs. (When located in a colder climate where snow accumulation and melt are important processes to include, the snow model parameters would need to be adjusted during model calibration to match historic estimates of snow water equivalent.)
In order to develop parameter sets for the wet/typical and dry watershed conditions, the modeler calibrated to events representing both conditions. The wet/typical condition represents average watershed conditions, while the dry condition represents the watershed with little or no precipitation for an extended amount of time. Two wet/typical events, one wet/snowmelt event, and one dry event were used to calibrate the model. Details of each calibration event are shown in the following table.
Watershed Condition | Start Date | End Date | Description |
|---|---|---|---|
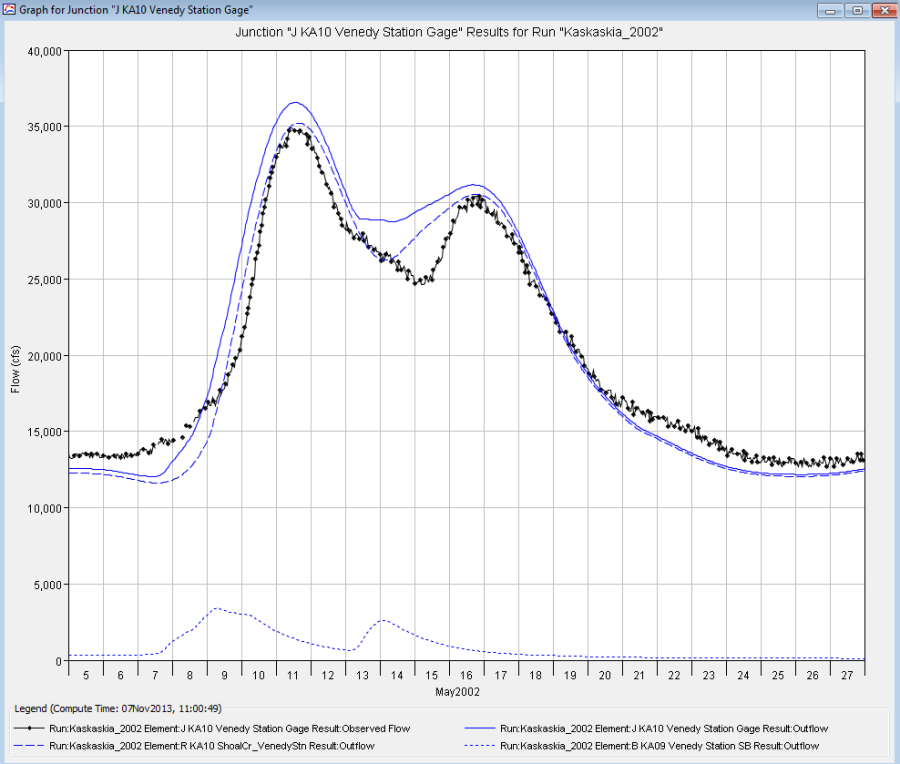
Wet/Typical | 05May2002 | 28May2002 | Event of record for the Kaskaskia basin, rainfall totals of 6-10 inches in May 2002 |
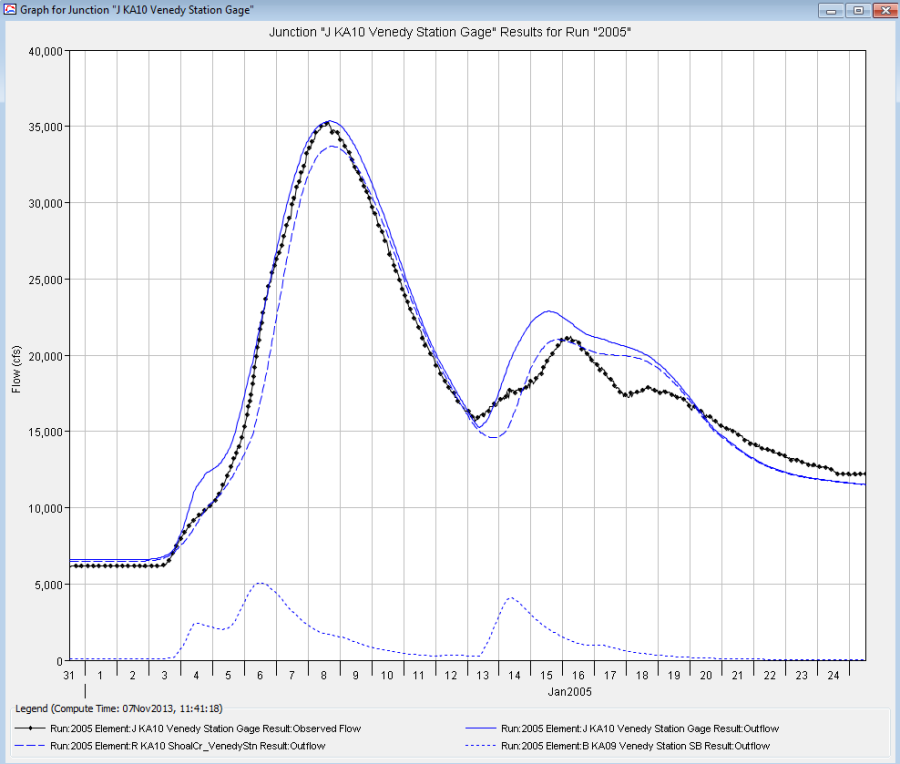
Wet/Snowmelt | 31Dec2004 | 24Jan2005 | Snowfall in late December followed by a rain and ice storm in early January in combination with above normal temperatures |
Wet/Typical | 17Apr2011 | 10May2011 | April 2011 set a record for average statewide precipitation with persistent rainfall continuing through May, |
Dry | 30Aug2012 | 13Sep2012 | Significant drought in summer of 2012, heavy rains from Tropical Storm Isaac brought 6-8 inches of rain in 7 days |
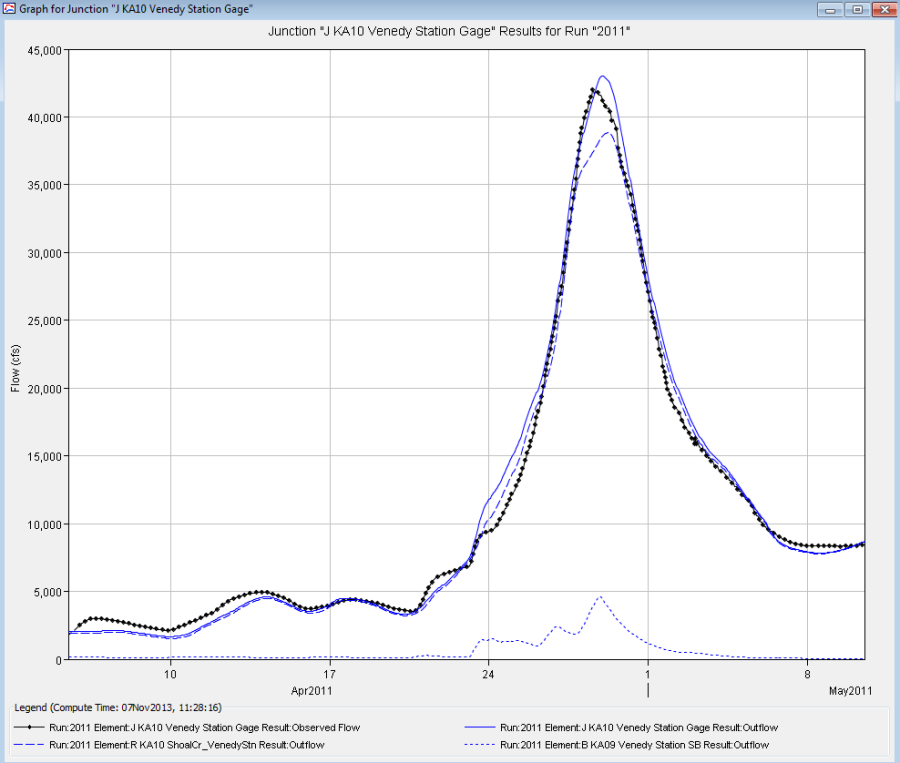
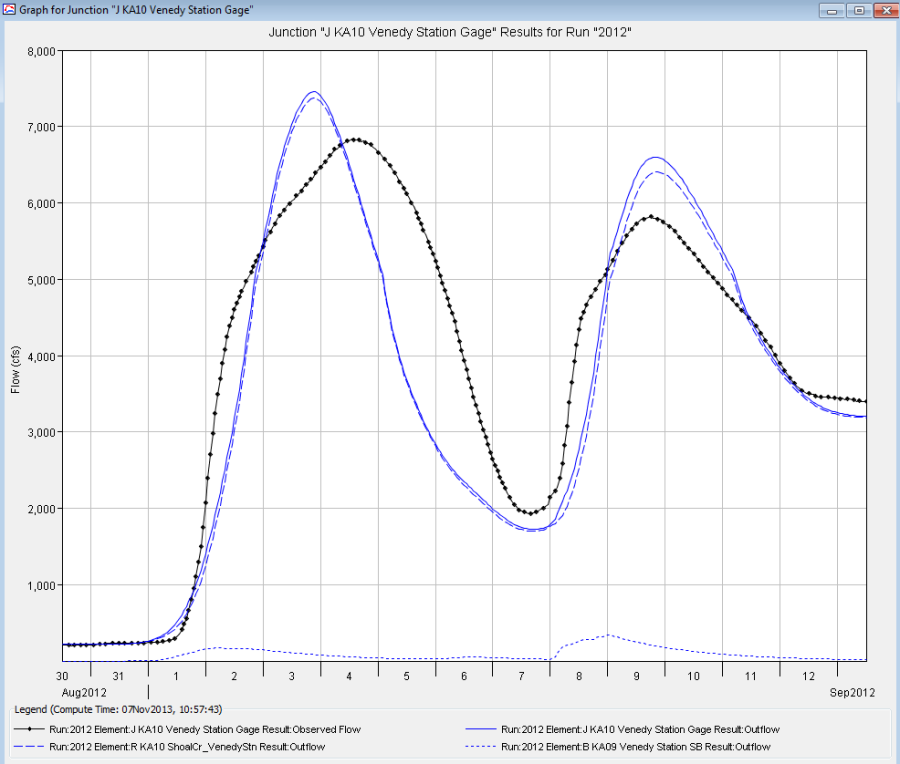
The modeler calibrated the Kaskaskia model to match peak flows, hydrograph shape, and hydrograph volume (USACE, 1994). Simply stated, model calibration is the process of adjusting model parameters, within a reasonable range, in order for the model to reproduce observed information (observed flow, reservoir stage, and snow water equivalent are a few observed data sources used to calibrate precipitation-runoff model). For the Kaskaskia model, peak flow and hydrograph shape were given priority over total runoff volume. The following four figures show the computed versus observed hydrographs from one of the gage locations in the lower portion of the Kaskaskia watershed for each of the calibration events (the dotted black line references the observed flow hydrograph and the solid blue line references the total compute flow hydrograph at this location).
After calibrating the model to each event, the modeler determined final parameters for the wet/typical, wet/snowmelt, and dry watershed conditions. Final wet/typical parameters were averaged for the two chosen calibration events. Final wet/snowmelt and dry parameters were taken directly from the calibration events. Separate basin models were created for the three watershed conditions and populated with the final parameter values.
After model calibration, the next step is verifying the model. Final model parameters determined from the calibration simulations are applied to additional flood events. Parameters representing initial conditions can be adjusted for the validation events to correctly represent the state of the watershed at the beginning of the simulation.
Application to Flood Forecasting
Flood forecasting involves configuring the forecast alternative and efficient real-time adjustments to the calibrated and validated model. Typical adjustments would include updating the soil moisture for current conditions, changes to infiltration rates, scaling unit hydrograph response times, modifying baseflow parameters, and scaling reach routing parameters. The process of flood forecasting in the Kaskaskia HEC-HMS model is described below. The steps included begin with the calibrated and validated HEC-HMS model. Specific information about completing the flood forecasting steps in HEC-HMS is described in greater detail here.
Preparing the Calibrated Model for a Forecasting Simulation
Once the forecast alternative simulation is created, it must be configured in order to use the forecast alternative specific editors. As mentioned, the forecast alternative editors do not edit parameter values in the basin model. The base model (calibrated model) is used as a starting point for estimating runoff for a forecast simulation. Some adjustments will be needed to the base model due to current conditions in the watershed and possible errors in observed data.
The steps to configuring a forecast alternative in HEC-HMS are:
- Set up zone configurations and elements within each zone for parameter adjustments.
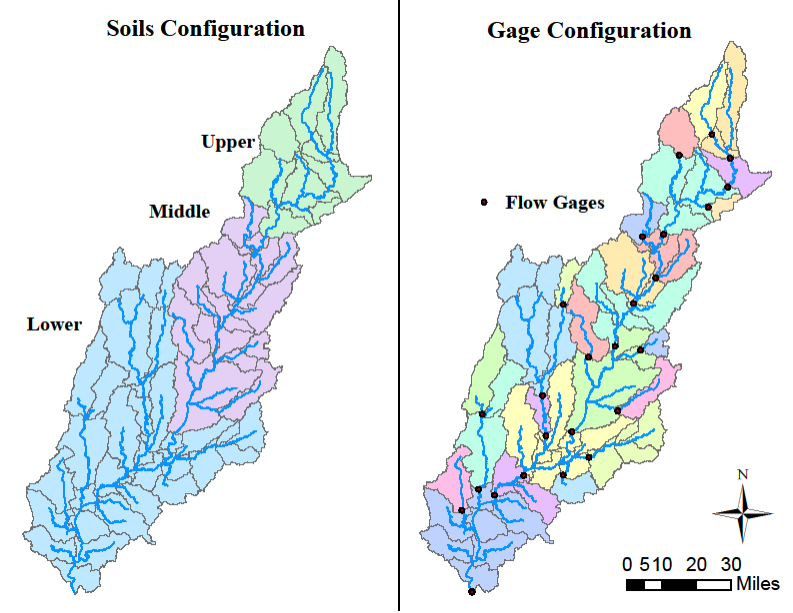
- The forecaster chose to divide subbasin zones in the Kaskaskia basin into two configurations: zones by stream gage locations, referred to as the "gage" configuration, and zones by soil types, referred to as the "soils" configuration. The gage configuration allows the grouping of subbasins by location so the user can quickly compare results of parameter adjustments to observed flows. The gage configuration includes 25 zones representing the basin's 25 stream gages. The soils configuration is composed of 3 zones representing areas of different soil types. Both configurations are shown in the following figure.
- Reaches can also be divided into zones for use in calibration. A reach zone configuration was not developed for the Kaskaskia because the forecaster determined that the channel routing parameters would not be adjusted during real-time forecasting simulations.
- Choose the relevant basin model and meteorologic model to be used in the forecast.
- The forecast alternative is constructed using the same initial conditions and parameters found in the selected basin model representing current watershed conditions. The forecaster chose the wet/typical watershed condition for this Kaskaskia forecast model as the conditions in the watershed were more aligned with the parameters in the wet/typical basin model.
- The meteorologic model represents observed and forecasted future precipitation for each alternative. The first alternative forecasts zero future precipitation, and the second forecasts 5 inches of precipitation in the upper portion of the watershed at the time of forecast. Assumptions were made about the hourly distribution of the precipitation forecast. The precipitation was assumed to fall uniformly over the upper portion of the watershed.
- Choose a time interval in which to compute the forecast.
- Based on available data and in order to capture the peak of the hydrograph, the forecaster chose a one-hour time step.
- Select appropriate zonal configurations for loss rate parameters, transform parameters, and baseflow parameters.
- The forecaster selected the soils zone configuration for the loss parameters because loss parameters are usually directly linked to soil types. The gage configuration was selected for the transform and baseflow parameters to quickly scale unit hydrograph timing and recession baseflow to improve model performance at flow gage locations.
Efficient Real-Time Adjustments to the Calibrated Model
Forecast alternatives allow the user to develop various forecasts showing the results of different inputs (meteorologic boundary conditions) in the model. In this case study, the forecaster chose to analyze two different precipitation forecasts. Each forecast alternative was configured the same except for the meteorologic model.
- Determine the time window for the forecast alternative. The forecaster chose a time of forecast date and time which was near the time of the last available observed data. The simulation start time was four days before the forecast start time, and the end time was selected as five days past the forecast start time, for a total simulation of nine days. The look back period was used to compare observed and computed results to help with calibration.
- Set boundary conditions for a flood forecast. Boundary conditions acting on the Kaskaskia include precipitation and evapotranspiration, both accounted for in the meteorologic model. Observed flow is also a boundary condition because the forecaster used forecast blending.
- Initialize conditions for a flood forecast, including baseflow and reservoir storage.
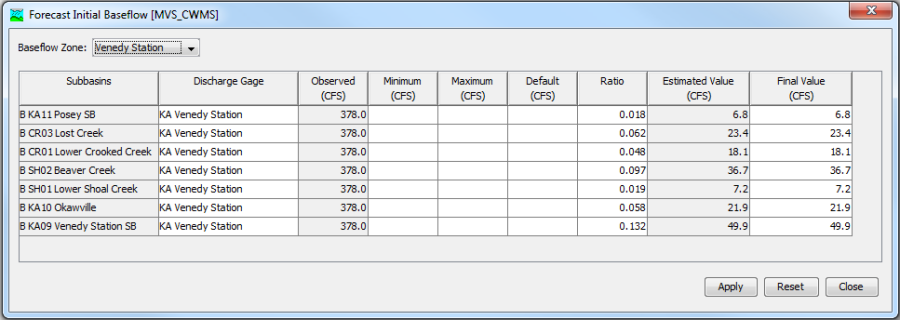
Initializing baseflow sets the flow condition for subbasins at the beginning of a forecast simulation. Observed flow provides a good source for calculating the baseflow initial condition. In the Forecast Initial Baseflow editor, the subbasins are divided by the zone configuration – for the Kaskaskia watershed, the gage zone configuration was selected. The following figure shows the Forecast Initial Baseflow editor for the Venedy Station zone. The forecaster selected an observed flow gage to determine flow at the start of the simulation. The ratio calculates the baseflow initial condition for each subbasin. This value was initially estimated as the ratio of each subbasin's area to the total drainage area of the selected gage.
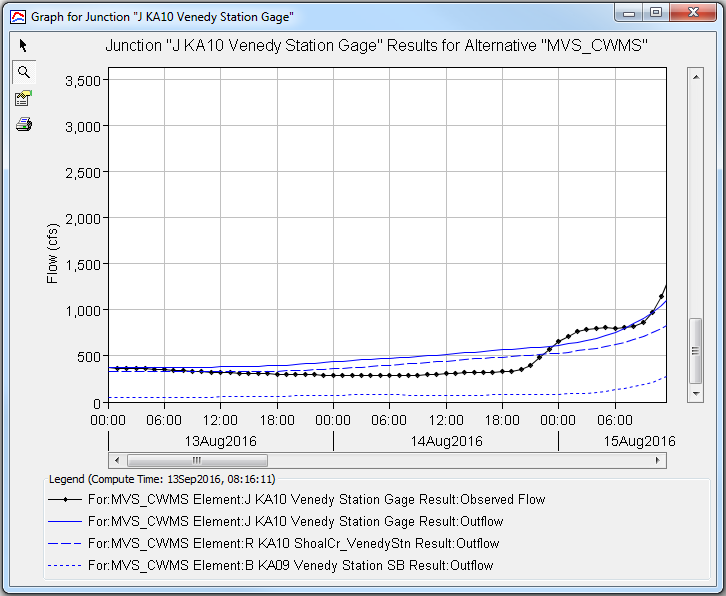
The forecaster then adjusted the ratios until the observed and computed initial baseflow values were similar, as is shown in the following figure (only part of the results plot is shown; the plot is zoomed into the look back period when observed flow data was available for real-time calibration). Minimum, maximum, and default values were not selected in this case because the gage data was scanned for missing or incorrect values before it was imported into the model. Developing appropriate ratios or ratio ranges can be completed when calibrating the model or prior to running the model in a true flood forecast mode. The ratio should be somewhat consistent; only minor adjustments might be needed from one simulation to the next.
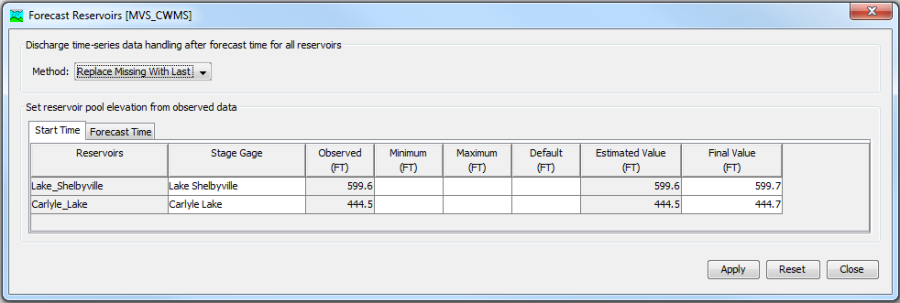
Reservoir initialization sets the initial pool storage based on elevation from observed stage gages and the input storage-elevation tables in the HEC-HMS model. In the Forecast Reservoirs editor, the forecaster selected the applicable stage gage for each of the reservoirs at the start time and the forecast time. Minimum, maximum, and default values were not selected in this case because the gage data was scanned for missing or incorrect values before it was imported into the model. The Forecast Reservoirs editor at the start time is shown in the following figure.
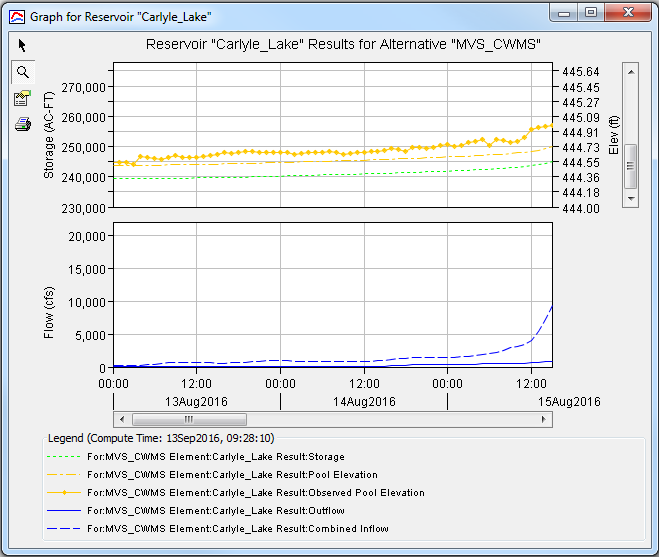
The following figure shows the pool elevation at Carlyle Lake at the start of the simulation.
Calibration and Application of the HEC-HMS Forecast Alternative
While calibration of the HEC-HMS forecast alternative includes each zone designated in the forecast alternative, this description of real-time calibration focuses on the Venedy Station gage zone, middle soils zone, Venedy stream gage, and associated subbasin elements.
Calibrate the model efficiently. Parameter values for subbasins and reaches were initialized to default from the wet/typical basin model. When parameter values were adjusted in the forecast alternative, no adjustments were made to the original wet/typical parameter values contained in the basin model. The parameter adjustments described below were made in forecast alternative specific editors.
- Forecast Parameter Adjustments - Parameters for loss, transform, and baseflow were edited in the Forecast Parameter Adjustments editors. During model calibration, the forecaster multiplied the constant rate of each subbasin in the lower and middle zones by 2 in the top half of the editor. The bottom half of the editor is used for overriding zonal edits by editing individual element parameters.
- Slider Adjustments - Instead of using the Forecast Parameter Adjustments editor, the forecaster used the Slider Adjustment tools to adjust Modified Clark transform parameters. The forecaster chose not to compute with each slider change, and instead manually computed the simulation (by clicking the compute button) after making each change.
- Forecast Blending - Forecast blending provides a method for systematically using observed flow to adjust computed streamflow. The forecaster selected the taper method for forecast blending and a taper duration of 72 hours.
- Computing to a Computation Point - The Venedy station gage was designated as a computation point. Therefore, after making parameter adjustments to the Venedy Station zone, the forecaster selected to compute to just the Venedy Station computation point to speed calibration. Only model elements upstream of the Venedy Station gage were computed when the compute to point option was used.
- Model Computational Efficiency - When parameters of the Venedy Station zone were adjusted and the model was recomputed, only components with data changes were recomputed. This feature provides another way to allow for efficient calibration of the forecast alternative.
Viewing and Analyzing Results
View and analyze results, and extract results for further analysis. The following figure shows the results of the first forecast alternative in which no precipitation was forecasted.
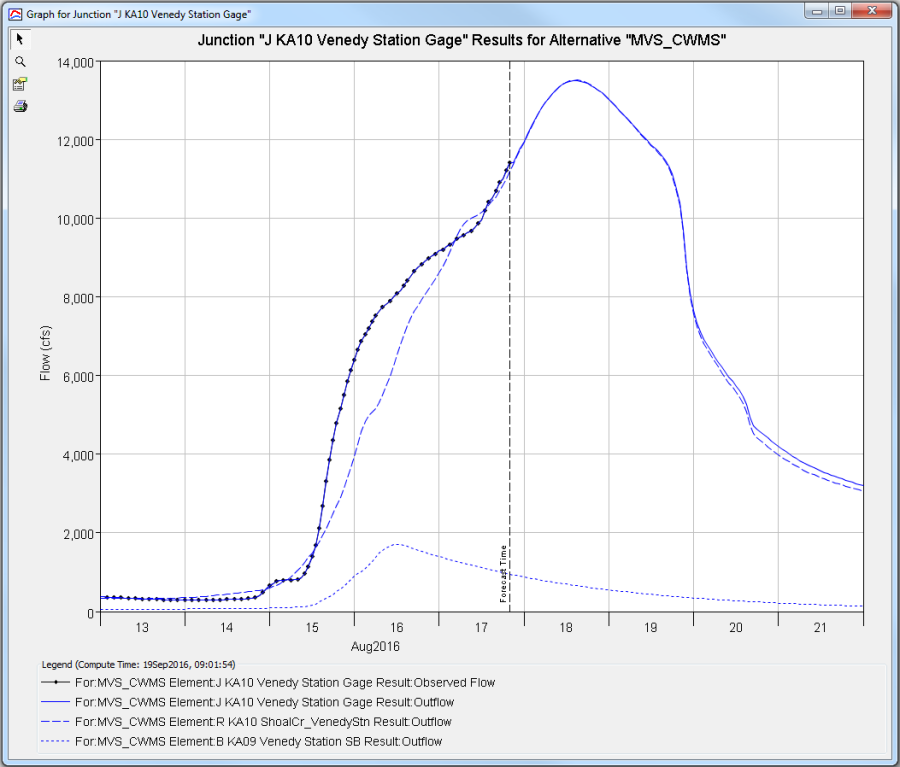
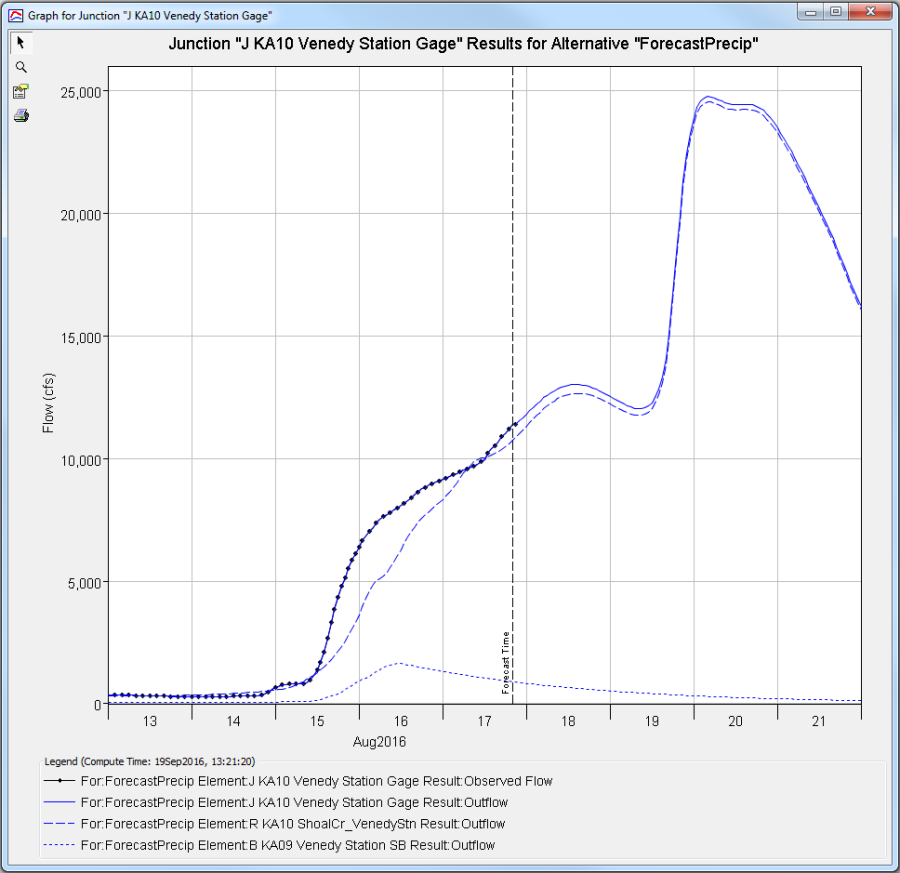
The following figure shows the results of the second alternative forecasting five inches of rain in the upper portion of the watershed at the time of forecast. The forecaster easily and efficiently compared the results of the two alternatives noting how the change in precipitation forecast affected the runoff response from the watershed. These results could then be used in reservoir flood operations or imported into additional model software like HEC-ResSim or HEC-RAS for reservoir operations or inundation mapping.
