Download PDF
Download page Case Study: Estimating Flood Frequency in the CRS SRS Watershed.
Case Study: Estimating Flood Frequency in the CRS SRS Watershed
Watershed Description
This case study is an extension of that described in the Urban Flooding Studies. There, a description is presented of how a USACE study team used HEC-HMS to evaluate the impact of development of 320 acres of open land in the CRS/SRS watershed. The CRS/SRS watershed is an urban watershed of approximately fifteen square miles within Sacramento County, in northern California. The HEC-HMS results indicated that development in the CRS watershed would increase the runoff by 6.6 percent (from 941 to 1,003 cfs) for the 0.01 AEP event at the Arden Way stream gage.
Decisions and Information Required
While the change in runoff for the 0.01 AEP event provides a useful, simple measure of the impact of development, this index alone is not adequate for complete assessment of the impact. It fails to account for changed flood damage due to development, and it fails to reveal the impact of the development with more- and less-frequent events. A complete frequency function is necessary for the latter, and flood damage analysis as described in the Flood-Loss Reduction Studies is necessary for the former.
Thus, as part of the feasibility study introduced in the Urban Flooding Studies, a USACE analyst has been tasked with answering the question: What is the increase in flood damage in CRS as a result of the development of 320 acres of open area?
Flood damage evaluations require development of an annual maximum flow frequency function, for the current- and future-development conditions. As described below, these functions were developed at each of the subbasin outlets identified in the Urban Flooding Studies; the locations are shown in the following table.
Subbasin ID | Outlet Location |
COR | CRS at Corabel Lane |
FUL | CRS at Fulton Avenue |
ARD | CRS at Arden Way |
Model Selection, Temporal Resolution, and Spatial and Temporal Extent
The study team used computer program HEC-HMS with frequency storms to develop all required frequency functions: current and future, without- and with-project. The current-condition, without project, frequency curve can be developed by other methods as previously noted, but the hydrologic model will be required to develop the future condition with- and without-project frequency curve. Alternative methods for estimating the existing-condition frequency curve are discussed at the end of this case study.
The HEC-HMS watershed and channel model described in the Urban Flooding Studies was used for this portion of the study. The model contained:
- Infiltration: Initial and constant-rate runoff-volume method.
- Direct-runoff transform: Snyder's unit hydrograph transform method.
- Baseflow: None used.
- Routing: Muskingum-Cunge eight-point channel routing method.
The spatial and temporal extents defined in the Urban Flooding Studies were the same for this portion of the study.
A two-minute computational time step, selected as described in the Urban Flooding Studies, was used for this study. The 24-hour storm duration, selected as described in the Urban Flooding Studies, was used for the frequency-based storms herein.
Model Calibration and Verification
The Urban Flooding Studies describes how the rainfall-runoff-routing model was calibrated and verified. The same parameters were used to develop the frequency function. Note that the initial conditions vary, as shown in the Initial Loss Values for the Sacramento Area table, depending on the event. For example, the initial loss of the 0.01 AEP event is less than that used for the 0.50 AEP event. In northern California, a 0.01 AEP event will not occur suddenly, on a sunny day. Instead, it will occur after a longer period of precipitation, caused by storms moving from the Pacific Ocean. Consequently, the soil is likely to be saturated when such a large event occurs, in which case, the initial loss would be small.
Application
To provide the information required the study team:
- Developed a range of hypothetical (frequency) precipitation events.
- Used the precipitation events as the boundary condition to the watershed model.
- Computed a peak flow for each frequency event for the current and future development conditions and assembled the results to obtain the desired frequency functions.
- Compared storm-frequency hydrologic-model results with other methods to obtain the best estimate of the current development frequency curve.
To develop the flow-frequency function, a range of hypothetical (frequency) precipitation events was used within the watershed model. The 0.01 AEP event used in the Urban Flooding Studies was based upon depths from locally-developed DDF functions. The same DDF functions were used to develop the precipitation-frequency functions needed here for seven other events; the following table shows these. HEC-HMS has eight predefined options for frequency storms. The specific frequencies provide adequate resolution of the frequency function. The frequencies correspond to the same annual exceedance probabilities shown below. All eight of the precipitation frequencies listed were used as a boundary condition for the watershed model, thus yielding eight quantiles for the frequency functions.
Duration | Depth (in) for Specified Annual Exceedance Probability | |||||||
0.50 | 0.20 | 0.10 | 0.04 | 0.02 | 0.01 | 0.004 | 0.002 | |
5 min | 0.13 | 0.20 | 0.25 | 0.32 | 0.38 | 0.44 | 0.49 | 0.58 |
10 min | 0.19 | 0.29 | 0.36 | 0.46 | 0.54 | 0.62 | 0.70 | 0.82 |
15 min | 0.23 | 0.35 | 0.43 | 0.55 | 0.64 | 0.73 | 0.82 | 0.96 |
30 min | 0.32 | 0.47 | 0.57 | 0.72 | 0.83 | 0.94 | 1.04 | 1.22 |
1 hour | 0.45 | 0.64 | 0.77 | 0.94 | 1.07 | 1.21 | 1.33 | 1.53 |
2 hours | 0.64 | 0.88 | 1.04 | 1.26 | 1.42 | 1.59 | 1.76 | 2.00 |
3 hours | 0.77 | 1.04 | 1.23 | 1.47 | 1.66 | 1.85 | 2.03 | 2.31 |
6 hours | 1.06 | 1.40 | 1.65 | 1.95 | 2.22 | 2.50 | 2.75 | 3.10 |
12 hours | 1.43 | 1.91 | 2.25 | 2.67 | 3.00 | 3.30 | 3.60 | 4.00 |
24 hours | 1.90 | 2.50 | 2.98 | 3.46 | 3.85 | 4.25 | 4.60 | 5.20 |
36 hours | 2.25 | 3.02 | 3.54 | 4.15 | 4.60 | 5.09 | 5.53 | 6.24 |
2 days | 2.51 | 3.40 | 3.95 | 4.65 | 5.15 | 5.70 | 6.20 | 7.00 |
3 days | 3.00 | 4.07 | 4.65 | 5.50 | 6.20 | 6.80 | 7.50 | 8.40 |
5 days | 3.61 | 4.91 | 5.76 | 6.85 | 7.63 | 8.42 | 9.20 | 10.29 |
10 days | 4.73 | 6.44 | 7.54 | 8.96 | 9.97 | 11.01 | 11.95 | 13.46 |
Meteorologic Models for the eight frequency events were added to the HEC-HMS input. (Because the 0.01 AEP precipitation input was completed in the Urban Flooding Studies, only seven additional models need be created.) To create a Meteorologic Model, the analyst:
1. Selected Meteorologic Model Manager from the Components menu and clicked the New button.
2. Entered a Name for the Meteorologic Model and a Description. The analyst used the AEP as the name so that it would be easily identified and clicked Create.
Such care in naming models is critical in a complex study such as this. The model may be needed in subsequent analyses or by another analyst, and finding and retrieving the model will be easier if a meaningful name is selected now. Similarly, record names used by HEC-HMS for storing data and results in the DSS data management system are formed from model and project names. If the records are to be retrieved for use with HEC-RAS or another tool, selection of informative model names is essential.
3. Connected the Meteorologic Model to the Basin Model by selecting the Basins tab in the meteorologic model Component Editor and switching the Include Subbasins option from No to Yes, as shown below.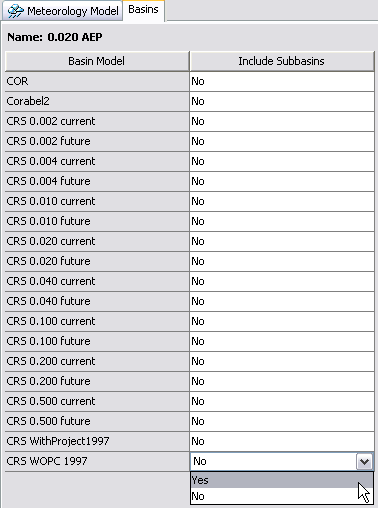
4. Specified the Precipitation Method by selecting Frequency Storm from the list, as shown in the following figure.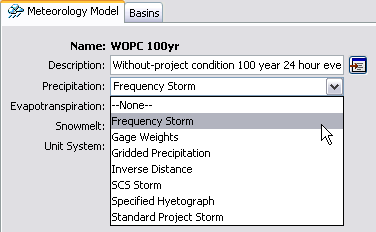
5. Entered the precipitation depth-duration data from the Depth-Duration-Frequency (DDF) Functions (inches) table, as illustrated below.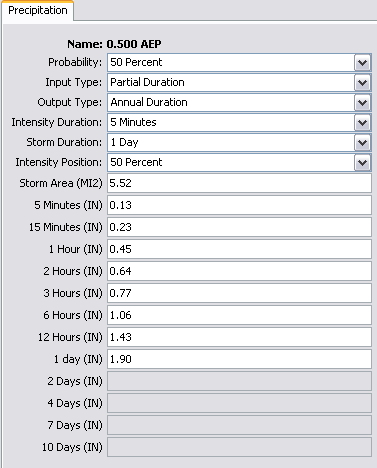
Here, the actual exceedance Probability is selected for each of the eight boundary conditions. (Note that the options shown in the HEC-HMS form are actually exceedance probability multiplied by 100, expressed as a percentage.) The Input Type identifies the series type of the depth-duration input data. This can be either Partial or Annual duration. The Output Type identifies the series type of the resulting flow data. If the Input Type and Output Type are the same then no changes are made to the specified values. If they are different, then HEC-HMS converts the specified values to partial or annual duration series depths for the 0.50, 0.20, and 0.10 AEP events. Multipliers from TP-40 (NOAA, 1961) are used for this.
The Intensity Duration controls how HEC-HMS defines the frequency storm; it uses the procedures described in the HEC-HMS Technical Reference Manual (HEC, 2000). The duration selected should equal the computation time step, as specified in the Control Specifications, if possible. Otherwise, a duration near the time step should be selected. If fifty percent is selected for Intensity Position, the peak intensity is at fifty percent of the duration - at twelve hours for a 24-hour storm. The Storm Duration is the total duration of the precipitation event that is to be analyzed. Note that this may be less than the maximum duration for which a depth is specified in the table, but it should not be greater. The analyst must ensure that the duration of the analysis, as defined by the Starting Date, Starting Time, Ending Date, and Ending Time in the Control Specifications, exceeds the duration of the rainfall. Otherwise, the entire watershed will not contribute to runoff. The Storm Area is used for depth-area correction, as described in the HEC-HMS Technical Reference Manual (HEC, 2000). For the CRS/SRS analysis, the Storm Area is the entire watershed area upstream of Arden Way. However, the areal correction for precipitation on this relatively small watershed is negligible.
Steps 1 - 5 were repeated to develop the eight required Meteorologic Models - one for each exceedance probability.
As described above, the initial loss varies with the hypothetical event. The less frequent the event is, the less the initial loss. To model this, the analyst created eight copies of the current development condition Basin Model (developed in Urban Flooding Studies) and eight copies of the future development condition Basin Model (developed in Urban Flooding Studies). Each was assigned to a hypothetical event and named accordingly. Then the initial loss value for each was modified. The resulting models are shown below. 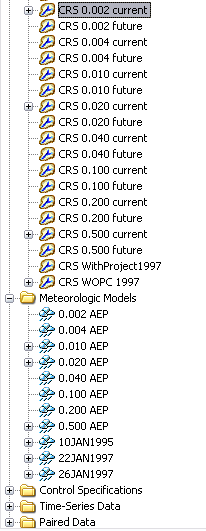
The analyst then created the Control Specifications to be used for all hypothetical events. To do so, the analyst:
- Selected the Control Specifications Manager from the Components menu and clicked the New button.
- Entered a name for the Control Specifications, gave a brief Description, and clicked Create.
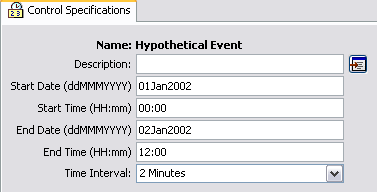
- Entered the Starting Date, Starting Time, Ending Date, and Ending Time for the runoff simulation. If the analyst were using an historical event, the known starting and ending dates and times would have been entered. However, with a hypothetical event, any starting date and time can be specified. (After all, the analyst is predicting what will happen if the event occurs, not forecasting when the event will occur.)
The Ending Date and Ending Time must be carefully selected. The simulation time window (Starting Time to Ending Time) must be great enough to permit simulation of the entire rainfall event plus the response of the entire watershed and channel system. This duration is the storm duration plus the travel time of the entire watershed. Here, to be safe, the analyst added twelve hours for the travel time to the 24-hour storm duration, and selected an Ending Time 36 hours after the Starting Time. The analyst also selected the appropriate Time Interval. The following image shows the completed control specifications.
The analyst computed the simulation runs for the current development condition Basin Models, being sure that the frequency of the Basin Model corresponded to the frequency of the Meteorologic Model. The without-project, current development peak flow from each of the eight frequency events at Arden Way is shown in the following table.
AEP | Peak Flow for Current Development Condition (cfs) |
0.500 | 285 |
0.200 | 450 |
0.100 | 571 |
0.040 | 715 |
0.020 | 826 |
0.010 | 944 |
0.004 | 1,060 |
0.002 | 1,230 |
Adopting a Frequency Curve
The following table shows alternative methods for deriving a frequency function for this watershed; these may be employed to check the reasonableness of the function derived as described above. All of those methods together with the frequency-storm method just developed provide important information about the frequency curve. Selecting an individual curve or a subjectively weighted average of some curves will depend on the confidence one has in the data available and the frequency method's use of that data. The process of adopting a frequency curve is described in TD-11 (HEC, 1980).
Method | Description |
Frequency storms | Precipitation events of known frequency are used with a rainfall-runoff model to compute a flow-frequency function. The example presented in this section uses this method. |
Regional regression equations for frequency curve quantiles | These estimate the peak flow for specific frequency events (the quantiles). For example, as described in Urban Flooding Studies, the USGS has developed equations to estimate peak flow for areas in California (Waananen, 1977). In this case, equations are available to estimate the 0.50, 0.20, 0.01, 0.04, 0.02, and 0.01 AEP flow peaks. Similar equations are available for the rest of the United States (Sauer, 1983; Jennings, 1994). |
Regional regression equations for frequency function parameters | Regional equations estimate the parameters of a frequency function, using watershed characteristics as the independent variables. For example, these equations may provide an estimate of the mean and standard deviation based upon watershed length, slope, and area. With these statistics, the frequency function can be defined, and quantiles determined. |
Statistical analysis or frequency-based runoff calculations for "hydrologically" similar watersheds | A frequency function derived for a "hydrologically" similar watershed can be transferred to (factored based upon drainage areas) and used for the watershed of interest. This option is more qualitative than the others. |
Frequency function fitted to gaged data | If a sufficient period of record is available, a frequency function can be fit, using, for example, HEC-SSP. From this, both quantiles and confidence limits can be defined. |
If gage records are good and exist for a relatively long period, say longer than thirty years, then a frequency function fitted to the data may be the method one has the most confidence in. But, fitting a frequency function to a short period of record is of limited use because of the significant uncertainty, especially when providing information for design or operation when public safety is an issue of concern. The guidelines in ER 1110-2-1450 (USACE, 1994b) recommend avoiding statistical analysis for short samples of data. Here, for illustration though, the analyst used the ten years of annual maximum flow at the Corabel Gage and developed a flow-frequency function using computer program HEC-SSP. The following table shows results. Column 1 shows the exceedance probability, and Columns 2 and 4 show the corresponding peak flows computed with HEC-HMS and HEC-SSP, respectively. The 0.50 AEP value compares well. However, the 0.01 AEP flow from HEC-HMS is about half the value predicted by fitting a distribution to the data.
AEP | HEC-HMS | USGS Regression Equation Peak Flow | HEC-SSP Quantiles | ||
|---|---|---|---|---|---|
Expected | 95% Confidence (cfs) | 5% Confidence (cfs) | |||
0.500 | 285 | 140 | 282 | 195 | 410 |
0.100 | 571 | 564 | 718 | 440 | 1,278 |
0.010 | 944 | 1,500 | 1,808 | 741 | 3,482 |
The analyst also looked at the peak flows estimated by the USGS regression equations, as described in the Urban Flooding Studies. These flows are included in Column 3 of the previous table.
The values predicted with HEC-HMS do fall well within the 95 and 5 percent confidence bands from HEC-SSP. These confidence bands describe the uncertainty about the fitted function. For example, the confidence bands for the 0.01 AEP event show that the probability is 0.90 that the true 0.01 AEP event is between 741 and 3,482 cfs. The HEC-HMS and USGS values fall in that range. If the HEC-HMS values did not, the analyst should reconcile this difference, seeking reasons why and perhaps correcting the HEC-HMS model. The USGS value for the 0.500 AEP event is below the lower end of the confidence band. However, as noted in Urban Flooding Studies, the watershed is below the applicable range of mean elevation for the equations. This and the uncertainty and variance in the equations may account for the low value.
Considering the short period of flow data available, the uncertainty and variance in the USGS regression equations, and that a calibrated rainfall-runoff model is available, the analyst decided the best-estimate flow-frequency curve would be from the frequency-storm method. Therefore, the peak flows computed by HEC-HMS were adopted as the flow-frequency curve.
Computing Future Development Frequency Functions
Once the current development frequency function was adopted, the next step was to develop the future development frequency function. The future development function is developed using a hydrologic model. The hydrologic model must be correlated to the adopted frequency curve. In so doing, changes in the frequency function can be calculated by modifying the model and using the same precipitation events. Modifications to the model may result from changes in land use or construction of flood control projects. The two basic methods to correlate the hydrologic model are to:
- Calibrate the peak flow from the hydrologic model to match the desired frequency.
- Assign a frequency to the peak flow from the hydrologic model based on the adopted frequency curve.
The adopted frequency curve in the example used the frequency storm method, so the precipitation frequency and the resulting flow frequency were assumed to be the same. This is the first method. Therefore, changes to the frequency curve due to future development were calculated by modifying the watershed characteristics and exercising the model with the same precipitation events used for the current development condition. Both methods are described in more detail herein.
Method 1. The steps included below describe an approach that entails fitting a watershed model to an adopted frequency function using loss values as the calibration parameter. This process is schematically shown in the following image and requires the following steps:
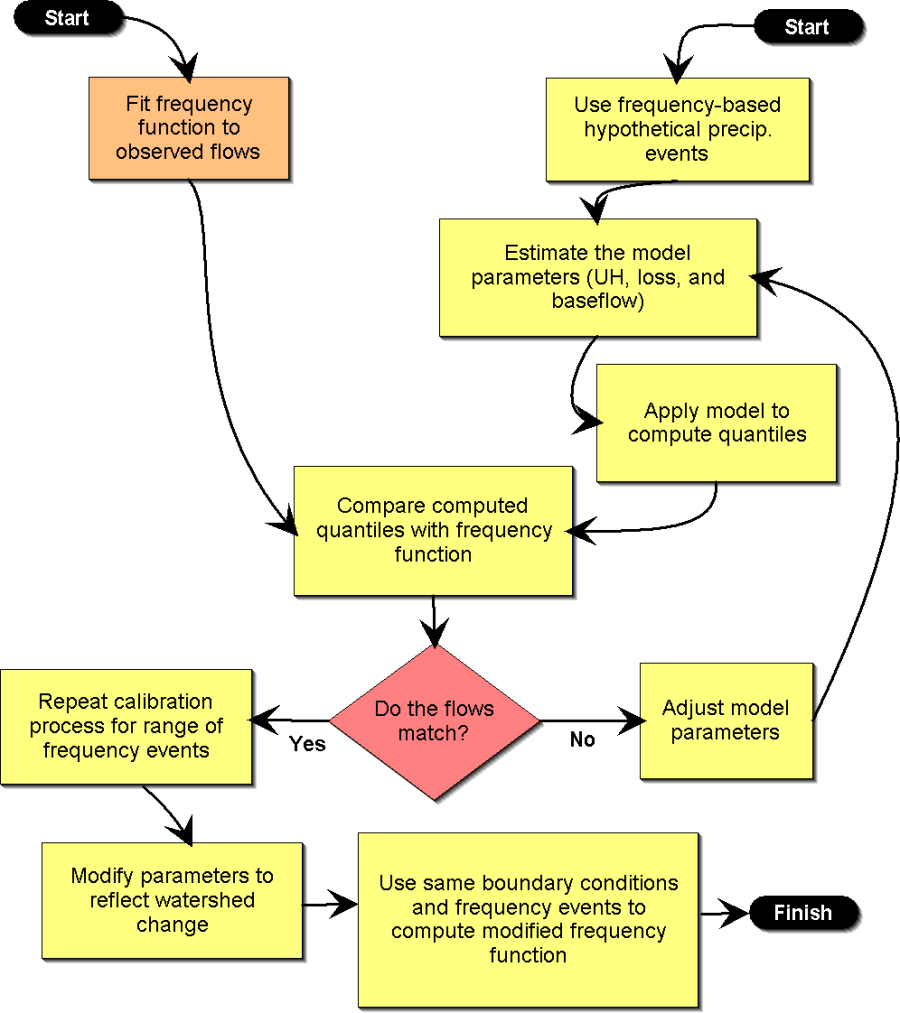
- Adopt a frequency curve. Use one or more of the methods from the Alternative Methods for Deriving Flow-Frequency Functions table to develop the best-estimate frequency curve, see Urban Flooding Studies.
- On a parallel path, use IDF or DDF functions as boundary conditions in HEC-HMS, as done in the example here. Use reasonable estimates of initial conditions and model parameters. Use the HEC-HMS model to compute runoff peaks for the frequency events.
- Compare the runoff peaks computed by HEC-HMS (Step 2) for a given frequency event to the flow from the adopted curve (Step 1) for the same frequency. For example, compare the runoff peak from HEC-HMS using the 0.01 AEP precipitation event with the 0.01 AEP peak flow from the adopted frequency function. (In the case where the frequency storm method is the adopted method, they are one in the same.)
- Adjust the HEC-HMS model parameters such that for a given frequency, the peak flow computed by HEC-HMS matches the peak flow from the function generated by HEC-SSP. The goal is to have the flow due to the n-AEP precipitation event (derived from precipitation-frequency studies) equal the n-AEP flow (from the adopted curve). Typically, the initial loss parameter is used as a calibration parameter because it represents antecedent moisture, which is a major factor in flood magnitude.
- Repeat this calibration process for a range of frequency events (the 0.50 to 0.002 AEP events).
- Modify the model parameters to reflect the future condition (land use change or with-project).
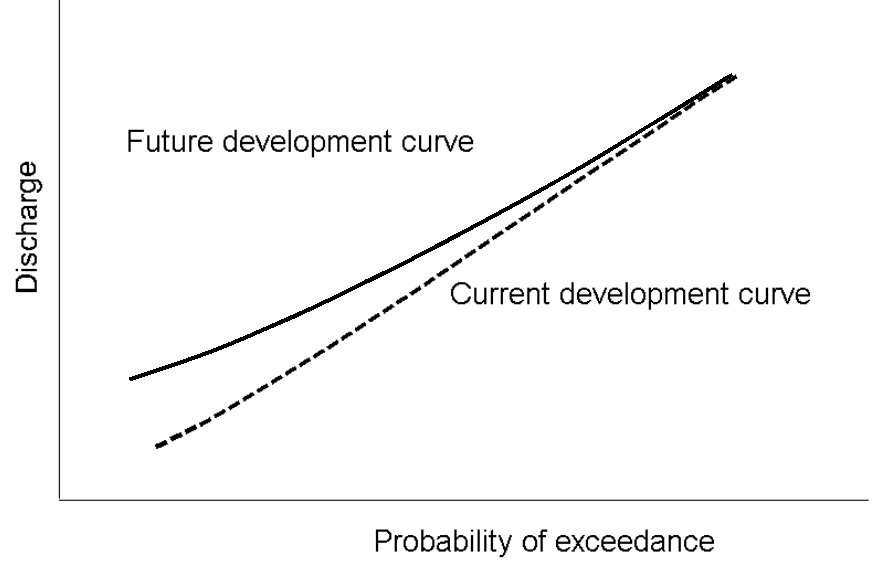
- Use the calibrated initial loss value for each frequency event along with the same frequency-based precipitation event to compute a future flow-frequency function. The resulting peak flows for the example are shown in the following table. The changes to the frequency curve are schematically shown in the following figure.
AEP | Peak Flow for Future Development Condition (cfs) |
0.500 | 308 |
0.200 | 481 |
0.100 | 608 |
0.040 | 760 |
0.020 | 876 |
0.010 | 999 |
0.004 | 1,120 |
0.002 | 1,296 |
When using the procedure described, care must be taken to ensure that the calibrated loss model parameters match regionally acceptable values. For example, when attempting to match the 0.10 AEP flow from the watershed model to the 0.10 AEP flow from the flow-frequency function, suppose a large initial loss is needed. If the value is beyond a reasonable range, then an alternative method needs to be considered.
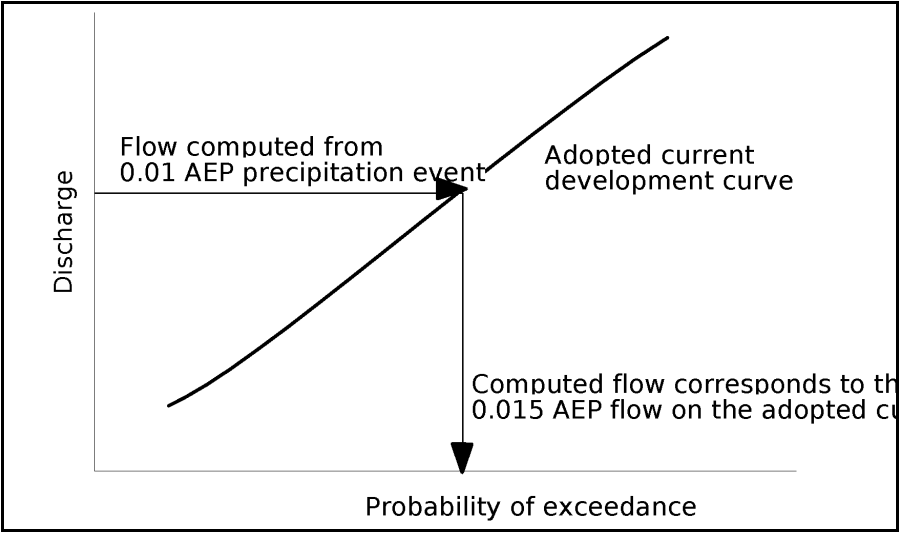
Method 2. An alternative method to develop a modified frequency curve based upon an adopted frequency curve is schematically shown in the following figure and is as follows:
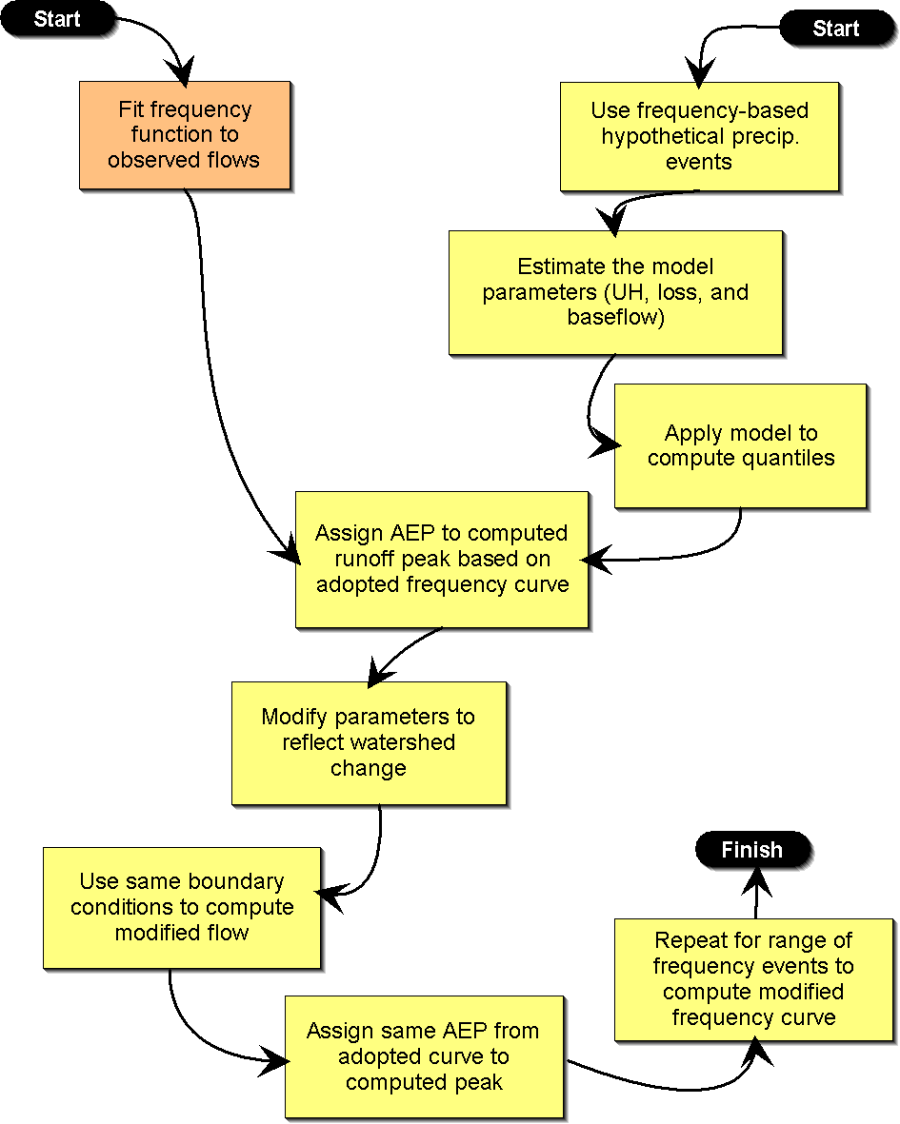
- Adopt a frequency curve for the current-development, without-project condition.
- Use IDF or DDF functions as boundary conditions in HEC-HMS. Use estimates of model parameters that are consistent with regional studies and data. For example, select an initial loss that is consistent with the soil type and precipitation volume. Use the HEC-HMS model to compute a runoff peak for the hypothetical frequency event.
- Assign an AEP to the runoff peak based upon the adopted frequency curve. Note that this frequency may differ from that of the boundary condition IDF and DDF functions. For example, as shown below, the 0.01 AEP precipitation event may yield the 0.015 AEP peak flow.
- Adjust the HEC-HMS model parameters to reflect the modified conditions. The modifications may reflect land use changes or projects for damage-reduction alternatives.
- Use the same boundary conditions with the modified model and compute a runoff peak.
- Assign the same AEP from the adopted frequency curve, as described in Step 3, to this computed runoff peak. Compare the change in peak flow as a result of the watershed modifications based upon the same boundary conditions.
- Repeat this process for a range of frequency events (the 0.50 to 0.002 AEP events).
Using Frequency Curves in Project Analysis
For the CRS/SRS analysis, computer program HEC-FDA was used to compute EAD. This program requires two main categories of input: (1) hydrologic and hydraulic data and (2) economic data. To complete the hydrologic and hydraulic data requirements, the computed peak flows must be converted to water surface elevations. For CRS/SRS, the analyst used computer program HEC-RAS to compute water surface elevations for the given flow rates from the frequency function. The analyst must then gather the required economic data. This includes information identifying vulnerable structures, first-floor elevations, structure value, content value, etc.
Once the EADs for the current and future development conditions are computed, the increase in EAD as a result of the land developed can be calculated.
In the Flood-Loss Reduction Studies, flood-damage reduction alternatives will be considered. The EAD computed in this section will serve as the basis for identifying the most cost-effective alternative for reducing flood damage.