Download PDF
Download page Case Study: Evaluation of Inundation-Reduction Benefits in the CRS Watershed.
Case Study: Evaluation of Inundation-Reduction Benefits in the CRS Watershed
Watershed Description
The Urban Flooding Studies and the Flood Frequency Studies described the CRS/SRS watershed. Flooding may occur there during events that exceed approximately the 0.04 AEP event. This history of flooding led to an effort to provide relief to the residents and property owners, and a flood-damage reduction study was initiated. The hydrologic engineering component of the study is to provide the flow-frequency functions and related uncertainty for without and with-project conditions. The with-project condition includes the following flood-damage reduction alternatives proposed by a USACE study team and the local sponsor:
Alternative 1: Detention pond upstream of Fulton Avenue.
Alternative 2: Off-stream detention. Similar to Alternative 1, but with an upstream diversion that is designed to pass some portion of the flow without detention.
Alternative 3: Diversion from CRS into SRS at Fulton Avenue.
Alternative 4: Floodwall along CRS, from D05 pond to Arden Way.
Alternative 5: Raise low-lying structures near Howe Avenue.
The specific dimensions and configuration of the measures included in the plans will be determined iteratively, using results of the hydrologic engineering and economic analysis. However, initial candidate dimensions were nominated and properties of the features of the measures were proposed by the study team. For example, a candidate outlet configuration of the detention pond was identified, and a candidate capacity of the pond for Alternative 1 was proposed.
Required Decisions and Necessary Information
The question that must be answered is: Which of the proposed plans, if any, should be funded and implemented? The information required to make that decision includes the inundation reduction benefit of each alternative plan. Computation of that benefit requires without and with-project frequency, rating, and damage functions.
The process for developing the best estimate frequency curve for the without-plan condition is described in the Flood Frequency Studies. In this case, Methods 1 and 2 are the same because the best-estimate flow-frequency curve is the frequency storm procedure. Thus, to develop the with-plan frequency curve, the analyst used the same hypothetical storms of known frequency with modified HEC-HMS models of the watershed and channels that reflect the appropriate alternative. The additional steps in the analysis with HEC-HMS include:
- Use developed meteorologic models with frequency storms for the watershed, as illustrated in the Flood Frequency Studies.
- Develop a basin model for Alternative 1, including in that model a representation of the proposed detention pond.
- Exercise that model with the frequency storms from Step 1 to develop the with-plan flow-frequency function for Alternative 1.
- Repeat Steps 2 and 3 for alternatives 2, 3, 4, and 5.
The analyst described the uncertainty associated with the frequency functions using an estimate of the equivalent years of record. Guidelines for estimating the equivalent years of record are found in Table 4 and 5 of EM 1110-2-1619 (USACE, 1996).
Model Selection, Fitting, and Boundary and Initial Conditions
For this analysis, the HEC-HMS model that is described in the Urban Flooding Studies and the Flood Frequency Studies was used for runoff computations. The analyst did complete the model by adding the remaining portion of the watershed. This was done following the same procedures and techniques described in the Urban Flooding Studies . The completed model is shown in the following figure. The hypothetical storms needed were developed as described in the Flood Frequency Studies. 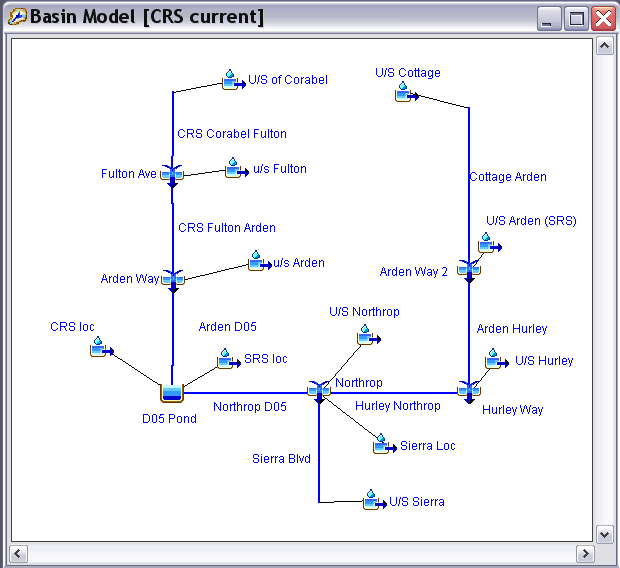
Additional model components required for analysis of the with-project condition include a model of the detention pond, a model of the diversion, a model of the floodwall, and a model of the impact of raising (elevating) the structures. HEC-HMS includes a simple detention model. To use this, the analyst can define a storage-outflow relationship for the pond and outlet works. Similarly, HEC-HMS includes a diversion model; the properties of the diversion can be described with a function that predicts flow into the diversion channel, given the flow in the channel at the point of diversion.
Modeling the floodwall alternative with HEC-HMS creates a technical challenge. For the without-project condition, the channel was modeled in HEC-HMS with the Muskingum-Cunge channel routing method; channel geometry and roughness values were available from previous studies. If the channel is modified by the proposed plan, the flow-frequency function may change slightly, especially if the modification limits spill into the floodplain. The spill creates a storage effect that is similar to the effect of a detention pond. Consequently, eliminating spill will remove storage in the watershed and perhaps increase downstream flows. To account for this, the geometric data used in the routing model, specifically the eight-point cross section, can be modified to represent the floodwall.
However, the most significant impact of the floodwall - the modification to the rating function - cannot be simulated well with HEC-HMS. Thus, for this study an HEC-RAS model of the channels was developed and used to compute stages. Rating curves were computed using HEC-RAS for both the without- and with-project condition. In each case, the appropriate flows from HEC-HMS were used as input to the hydraulic model. The floodwall also alters the stage-damage function in HEC-FDA, up to the point where the floodwall overtops.
Similarly, simulating the impact of elevating the structures cannot be accomplished with HEC-HMS. This raising will have an insignificant impact on the frequency function, as it will do little to change watershed runoff or river routing characteristics. Instead, it will alter the damage incurred as water reaches a specified elevation in the floodplain. This is represented by the elevation-damage function, an input to the EAD computations. Thus, modeling this alternative is accomplished by changing no features of the HEC-HMS model, but by changing the economic function used by HEC-FDA.
Application
Here is how the analyst completed the steps shown to define the required flow-frequency functions:
1. Meteorologic models. The required frequency storms were developed using the HEC-HMS option for such. Depths for various durations for the eight hypothetical events were entered in the appropriate forms; the Input for 0.500 AEP Precipitation Event is an example of this.
2. Basin model for the without-plan condition. The without-plan condition model was developed as described in the Urban Flooding Studies . However, for this study, the entire watershed was modeled rather than just a portion. Note that the study team here had to account for the forecasted land use change in the watershed by creating two models: one for current without-plan condition and another for future without-plan condition. Runoff from the hypothetical events was computed using both models.
3. Without-plan flow-frequency function. In the Flood Frequency Studies, a without-plan, current development frequency curve was adopted. HEC-HMS was used to develop the without-project, future development frequency curve. Both curves are shown in the following table. These frequency functions were used as input to HEC-FDA to compute without-plan EAD. The HEC-FDA program includes an algorithm to account for the changing EAD as watershed conditions change and to compute the present value and equivalent average annual value of the inundation damage. Uncertainty in the frequency curves is accounted for in the EAD computations.
AEP | Peak flow for current development condition | Peak flow for future development condition |
0.500 | 285 | 308 |
0.200 | 450 | 481 |
0.100 | 571 | 608 |
0.040 | 715 | 760 |
0.020 | 826 | 876 |
0.010 | 944 | 999 |
0.004 | 1,060 | 1,120 |
0.002 | 1,230 | 1,296 |
4. Basin model for Alternative 1. The basin model for Alternative 1 was developed, for both current and future condition. To do so, the analyst duplicated the subbasins and routing reaches included in the without-plan basin models, with the same model parameters and initial conditions.
The analyst added the proposed forty-acre detention pond, using the reservoir element, to these basin models, as shown in the following figure. To specify the properties of the detention, the analyst selected the reservoir element in the basin model map and then edited the element properties in the Component Editor. 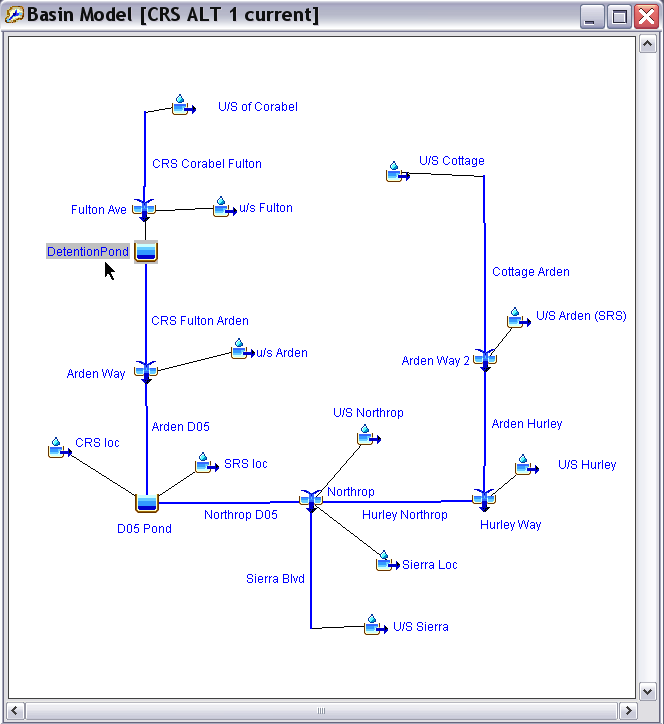
As shown in the following figure, the Outflow Curve reservoir routing method was chosen. When this method is chosen the analyst must compute the outflow from the reservoir for a range of elevations and storage volumes. Other reservoir routing options include Outflow Structures and Specified Release. When Outflow Structures is selected, the analyst must define an elevation-storage or elevation-area relationship and enter properties for outlet structures. Outflow structures in HEC-HMS include low-level outlets, culverts, spillways, pumps, and dam overtopping. When Specified Release is selected, the analyst must define an elevation-storage or elevation-area curve and a time-series of outflow from the reservoir. This option is useful when calibrating a model and observed releases from the reservoir are known. In this example, the analyst selected the Elevation-Area-Outflow storage method. Then the analyst selected the elevation-area and elevation-discharge curves associated with the reservoir. The specified elevation-area relationship is used by the program to compute the storage-volume relationship of the pond. The pond design considered is an excavated pond, so the required relationship was determined with solid geometry computations completed in a spreadsheet program. The elevation-discharge curve contains the total outflow from the pond for the corresponding elevations. Finding these values was a bit more difficult, as it required modeling the hydraulic performance of the pond's outlet and emergency spillway. The spillway was modeled in a spreadsheet, using the weir equation, to develop the elevation-discharge relationship.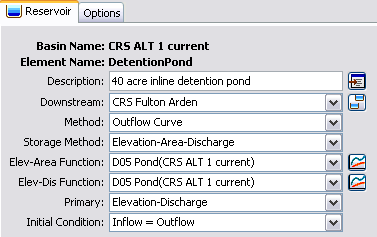
Modeling the performance of the detention pond's normal outlet was more difficult, as the performance of that outlet depends upon the flow condition. The outlet proposed is a culvert. Culverts can flow under inlet control or outlet control. In the first case, the discharge through the culvert, and hence the outflow from the detention, is a function of the cross-sectional area of the culvert, the inlet configuration, and the headwater elevation. In the second case, the discharge is a function of the tailwater elevation (which in turn, may be a function of the discharge) and the properties of the culvert, including slope, roughness, and length. In this case, the analyst used nomographs to develop the rating for the culvert. Another option would be to let HEC-HMS compute the outflow from the reservoir. The reservoir element has options to let the analyst define outlet structures; culvert and spillway outlets are included.
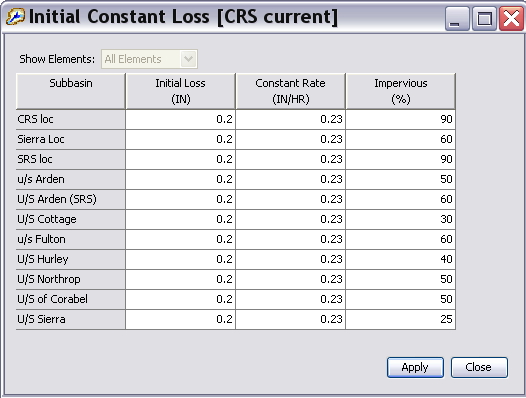
5. With-plan flow-frequency function for Alternative 1. After the basin models with the detention pond in place were developed, the analyst ran the models with eight hypothetical storms and computed runoff peaks for the present and future conditions. In the Flood Frequency Studies the analyst created a separate Basin Model for each hypothetical storm because the initial loss differed for each event. This time, the analyst chose to use one basin model and change the initial loss before each run. To simplify this procedure, the parameter values were altered in the global parameter editor. To do so, from the Parameters menu, point to Loss, and click Initial and Constant. The values were then set in the resulting window, as shown below.
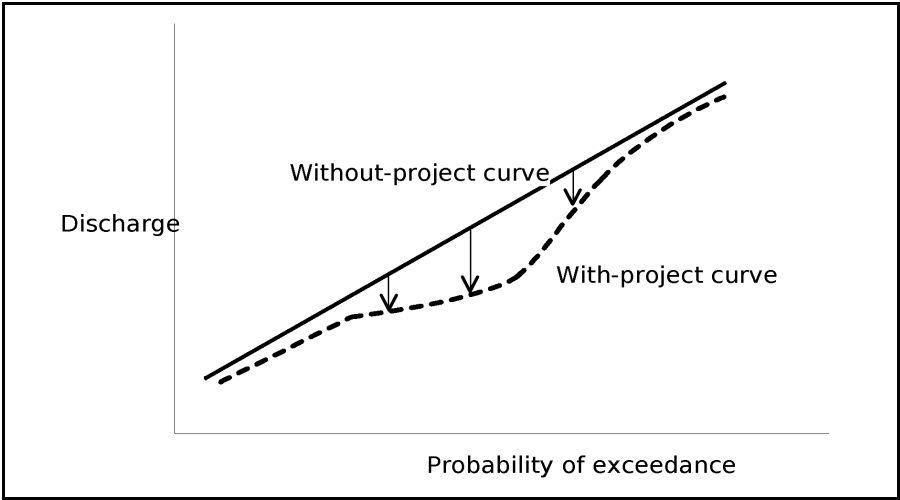
The peak runoff results for each hypothetical storm are shown in the table below. Column 2 shows the flow-frequency curve with the detention pond in place, for the current development condition. Column 3 shows the flow-frequency curve with the detention pond in place, for the future development condition. Comparing these curves to the without-project condition curves, as shown in the Without-Project, Current Development Peak Flow at Arden Way table in Chapter 3, it is evident that the flow from each hypothetical storm is reduced. This is conceptually shown in the figure below.
AEP | Peak Flow for Current Land Development Condition | Peak Flow for Future Land Development Condition |
0.500 | 231 | 249 |
0.200 | 357 | 375 |
0.100 | 441 | 464 |
0.040 | 540 | 569 |
0.020 | 616 | 649 |
0.010 | 694 | 731 |
0.004 | 771 | 812 |
0.002 | 936 | 1,004 |
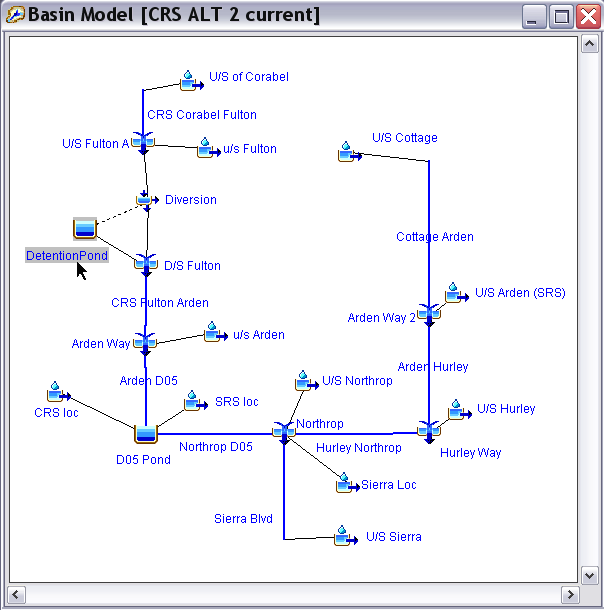
6. Basin model for Alternative 2. Alternative 2 is similar to Alternative 1, but the study team thought that the size of the detention area might be reduced from forty acres to twenty acres if a diversion was included to bypass the detention, permitting flow equal the 0.04 AEP event. This configuration was included in the basin model by again beginning with the without-project subbasin model and adding a diversion, a twenty-acre detention area, and a junction downstream of the pond. The flows that bypass the pond are retrieved and added to the downstream channel at this junction. The following image illustrates the resulting basin model.
To describe the diversion, a performance function must be entered in the paired data Component Editor, illustrated below. This shows how much flow enters the diversion channel, given flow entering the diversion control structure. For this alternative, the structure is designed to divert portions of the flows that exceed the 0.04 AEP event at Fulton Avenue, or approximately 600 cfs. 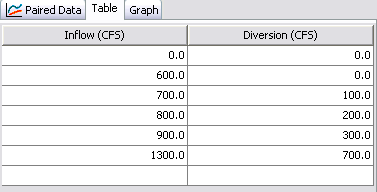
For this alternative, the detention is described as before, specifying the elevation-area-outflow relationship for the reduced capacity pond.
The junction added downstream of the detention permits retrieval of the diverted hydrograph, which is added to the outflow hydrograph from the pond. As the outflow from the pond is less than the unregulated flow into the pond, the downstream flow rate will be less than the without-project flow rate.
7. With-plan flow-frequency function for Alternative 2. After the basin models with the detention and diversion in place were developed, the analyst ran the models with the eight hypothetical storms and computed runoff peaks for the present and future conditions. The results are shown in the following table.
AEP | Peak Flow for Current Land Development Condition | Peak Flow for Future Land Development Condition |
0.500 | 285 | 309 |
0.200 | 445 | 483 |
0.100 | 569 | 610 |
0.040 | 713 | 762 |
0.020 | 824 | 868 |
0.010 | 928 | 977 |
0.004 | 988 | 1,041 |
0.002 | 1,063 | 1,140 |
8. Basin model for Alternative 3. The following image is a sketch of the proposed inflow to the diversion channel for Alternative 3. Water will overflow a side-channel spillway into the diversion channel, which will be connected to SRS, where the likelihood of flood damage is less.
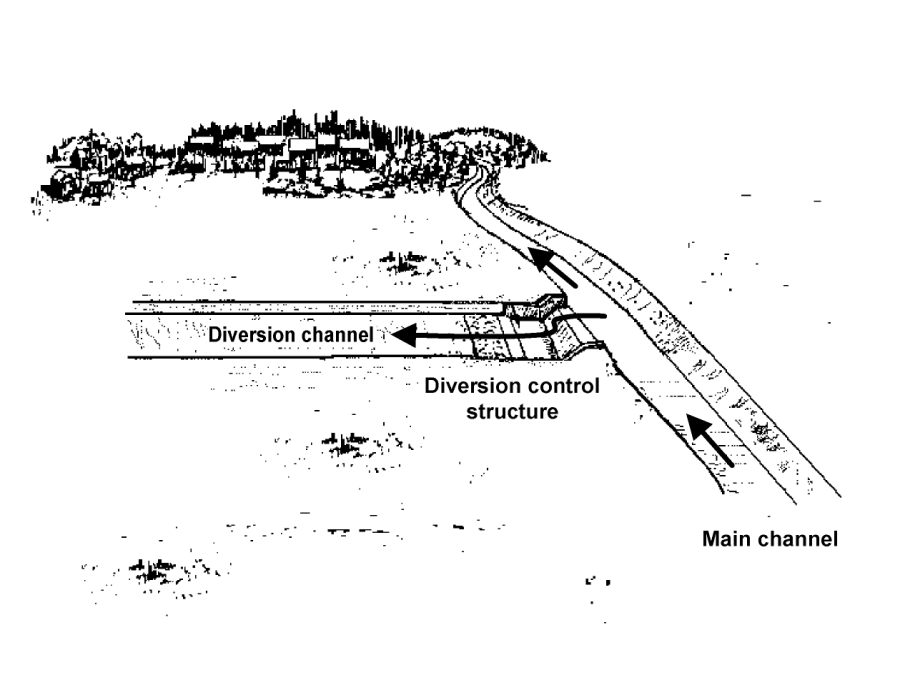
The following figure illustrates the configuration of the basin model for this alternative. This alternative includes a model of the without-project condition subbasins. It also includes a model of the diversion in the CRS watershed. The diversion channel is connected to a junction in the SRS watershed. There, the diverted flow hydrograph is retrieved and added to the channel flow by including a junction, as shown. The total flow is then routed down SRS. 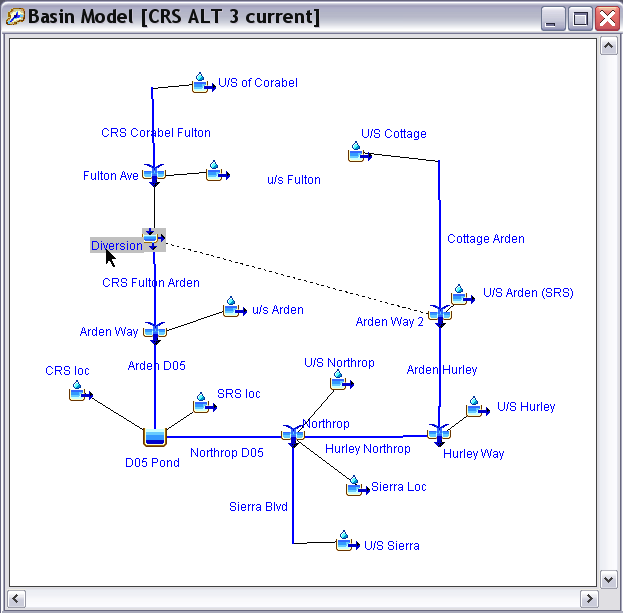
The properties of the diversion were specified by the analyst in the inflow-diversion function table. The rating in this case was derived by developing an HEC-RAS model of the spillway with proposed dimensions and running that model with a range of steady flows to determine the flow rate into the diversion. The resulting diversion performance is shown in the following table.
Inflow to diversion | Diverted flow |
500 | 0 |
700 | 100 |
800 | 150 |
1,200 | 300 |
2,000 | 600 |
9. With-plan flow-frequency function for Alternative 3. After the basin models with the diversion in place were created, the analyst ran the models with the eight hypothetical storms and computed runoff peaks for the present and future conditions. The results are shown in the following table.
AEP | Peak Flow for Current Land Development Condition | Peak Flow for Future Land Development Condition |
0.500 | 285 | 309 |
0.200 | 445 | 483 |
0.100 | 569 | 610 |
0.040 | 713 | 751 |
0.020 | 804 | 830 |
0.010 | 882 | 911 |
0.004 | 957 | 989 |
0.002 | 1,071 | 1,113 |
10. Basin model for Alternative 4. As noted above, the changes in channel geometry due to the proposed floodwall will have little impact on the flow-frequency curves in the basin. Instead, the most significant impact will be in changes to the rating curves and the stage-damage curves used with HEC-FDA for EAD computations. Nevertheless, for completeness, the analyst created basin models for Alternative 4 to compute flow-frequency curves. These were identical to the without-plan models in their configuration, but the analyst modified the eight-point cross-section representation for the Muskingum Cunge routing reaches to represent the floodwall.
11. With-plan flow-frequency function for Alternative 4. After the basin models with the modified channel data were created, the analyst ran the models with the eight hypothetical storms and computed runoff peaks for the present and future conditions. The results at Arden Way are shown in the following table. Note that Arden Way is the upstream end of the proposed floodwalls; therefore, the frequency function is the same as the without-project condition at that point in the system.
AEP | Peak Flow for Current Land Development Condition | Peak Flow for Future Land Development Condition |
0.500 | 285 | 309 |
0.200 | 445 | 483 |
0.100 | 569 | 610 |
0.040 | 713 | 762 |
0.020 | 824 | 879 |
0.010 | 941 | 1,003 |
0.004 | 1,057 | 1,124 |
0.002 | 1,226 | 1,301 |
12. Basin model for Alternative 5 and with-plan flow-frequency function. As noted above, Alternative 5 does not alter the frequency functions, so modeling its impact does not require modifying any of the features of the HEC-HMS models. Instead only the elevation-damage data that are specified with HEC-FDA will be changed. Therefore, the basin model for Alternative 5 is identical to the basin model for the without-plan condition, and the with-project frequency functions are identical to the without-project functions.
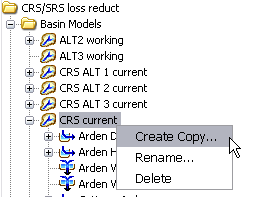
For completeness, and to avoid any confusion in the future, the analyst created basin models for Alternative 5. There are multiple ways to copy basin models in HEC-HMS. As shown in the following figure, the analyst place the mouse over the existing basin model name in the Watershed Explorer and clicked the right mouse button. In the resulting pop-up menu the analyst selected the Create Copy menu option.
Processing of Results
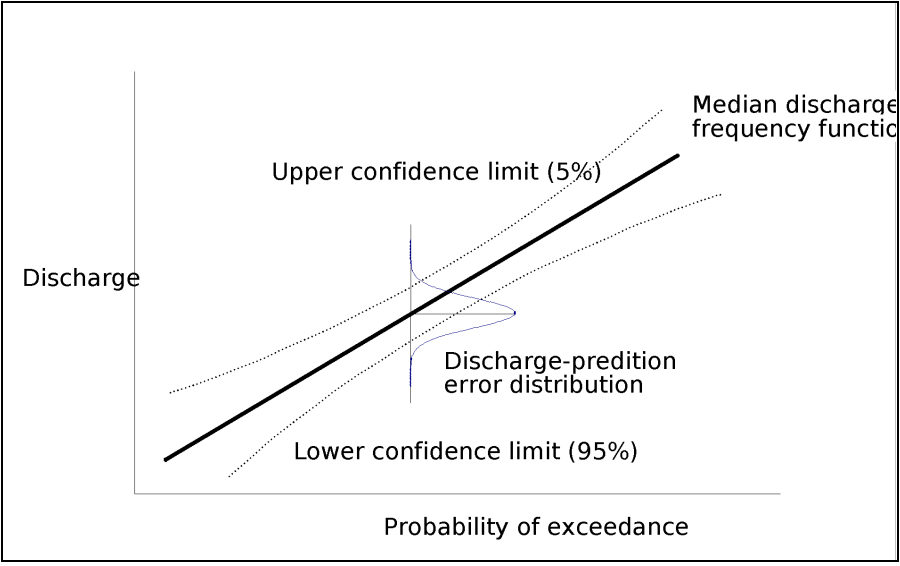
After all original alternatives were analyzed with HEC-HMS, the required frequency functions were available for EAD computations. Additional analyses with HEC-RAS were required to establish the elevation-discharge functions, and an extensive data collection effort was required to establish the elevation-damage functions. Then computer program HEC-FDA was run, and the EAD values for the CRS/SRS watershed were computed. The following table shows the results. During the EAD computations, a description of the uncertainty was included in the form of an estimate of the equivalent years of record. Guidelines from EM 1110-2-1619 (USACE, 1996) were used to estimate the equivalent years of record to be ten. The result is that a probability distribution is used to estimate the flow for a given frequency event, as illustrated in the following image. Based upon this distribution, confidence intervals can be drawn to illustrate the associated uncertainty in the values.
Condition | EAD | Inundation Reduction Benefit |
Without-project | 606 | — |
Alternative 1 | 228 | 378 |
Alternative 2 | 322 | 284 |
Alternative 3 | 477 | 129 |
Alternative 4 | 501 | 105 |
Alternative 5 | 559 | 47 |
The frequency functions computed for the proposed plans provide other information useful for systematic comparison of the plans and for selection of the optimal plan. For example, the probability of capacity exceedance of each plan (commonly referred to as the level of protection) can be found from the frequency functions. With this, the long-term risk associated with each plan can be computed. EM 1110-2-1619 (USACE, 1996) describes the computational methods. EM 1110-2-1619 (USACE, 1996) calls also for modeling the uncertainty in the frequency functions; this uncertainty is a consequence of lack of data and lack of certainty about models and parameters. With models of the uncertainty, sampling methods will permit computation of conditional non-exceedance probabilities. For example, with the uncertainty models and sampling, the analyst can determine the probability that a floodwall designed to eliminate flooding due to the 0.01 AEP event will, in fact, be overtopped by the 0.04 AEP event. This error in design is not a consequence of carelessness; rather, it is a consequence of uncertainty about the true value of the 0.01 AEP water surface elevation.