Download PDF
Download page Case Study: PMF Evaluation of Spillway Adequacy for Bonanza Reservoir.
Case Study: PMF Evaluation of Spillway Adequacy for Bonanza Reservoir
Watershed and Reservoir Description
Bonanza Dam and Reservoir are located on Hoss Creek in the central Sierra Nevada mountain range of California. The reservoir was completed in 1958 with the construction of Bonanza Dam, a rockfill structure. The reservoir and dam are shown in below. 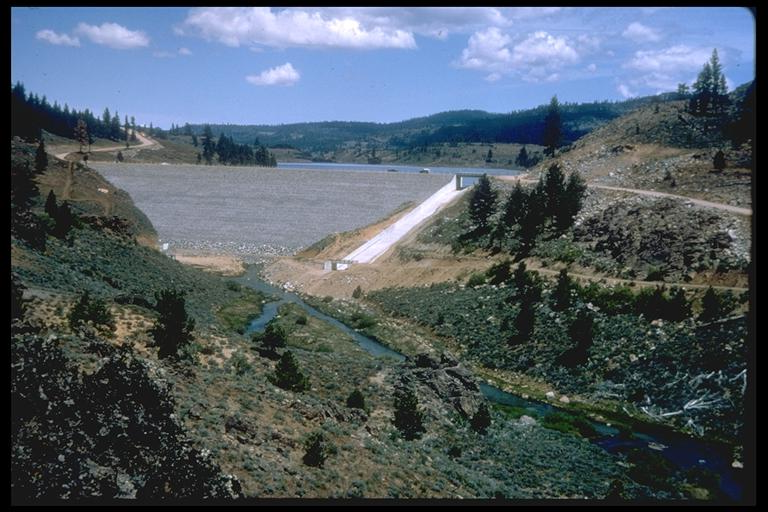
The reservoir was constructed primarily to store water for power generation, but it provides incidental flood control and water supply. Releases are made also for fish and wildlife needs downstream. The top of the dam is at elevation 4,192 feet. The reservoir is connected by an 11,000-foot tunnel to a power plant at elevation 2,300 feet. Usable reservoir capacity is 123,286 acre-feet between elevations 3,900 feet (invert of the power tunnel) and 4,184 feet, the spillway crest elevation. The contributing watershed area to the reservoir is 39.7 square miles.
Decisions and Information Required
The Bonanza Dam spillway initially was designed to carry safely a large event - thought to be approximately the 0.001 AEP (1,000-year) flood event. However, the risk of failure is of concern, so the spillway capacity is to be the PMP and PMF. USACE analysts have been asked to answer the following questions:
Will the existing spillway pass the PMF? That is, will the dam be overtopped if the PMF flows enter the reservoir? If not, how can the dam and spillway be modified to pass safely the PMF?
To answer the questions, the PMF must be computed and routed. The spatial extent of the analysis was limited to the portion of the watershed that contributes flow to the reservoir, to the reservoir itself, and to the area immediately downstream. This contributing area had been defined in the design studies; otherwise the analyst could have used topographic data to delineate the watershed. In this case, the model extended downstream of the reservoir only a short distance. However, if development in the downstream floodplain is such that dam failure poses a significant risk, the model should be extended further. Only by doing so will information be available for assessing the risk and for developing emergency plans.
Model Selection and Parameter Estimation
For this analysis, runoff-volume and direct-runoff transform methods are needed. As shown in the Summary of Simulation Methods Included in HEC-HMS table, a variety of options are available with HEC-HMS. Here the analyst selected the following:
- Runoff volume method. The analyst chose the initial and constant-rate runoff volume method. This method was used to represent the watershed characteristics during dam design. During PMF analysis, a common assumption is that the antecedent moisture saturates the soil before the PMP occurs. When this happens, the rate of infiltration approaches a constant value. The advantage of the initial and constant-rate method is that this physical condition can be represented well with the model. Another advantage is the simplicity of the method, which has only two parameters. Like many watersheds upstream of remote dams, the Hoss Creek watershed has no stream gage and few rain gages. Of course, inflows to the dam could be inferred from records of release and storage. However, the lack of rainfall data makes calibration of a more complex runoff volume method impossible. It could be argued that the analyst should use the CN loss method. However, the analyst felt that locally-developed predictors of the constant loss rates as a function of land use and soil type were preferable to the CN predictors, which have been developed as national averages. With the CN loss method, the loss rate is continuously decreasing towards zero as opposed to being a constant rate. Also, the CN loss method is not sensitive to rainfall intensity.
- Transform method. The analyst selected Clark's unit hydrograph. Again, this is the method that was used previously to represent the watershed characteristics in design studies. This method requires two parameters: time of concentration, Tc, and storage coefficient, R. Studies by the California Department of Water Resources yielded predictors for these parameters. The analyst did use the rather limited rainfall data for three historical events and computed reservoir inflow hydrographs using the Clark unit hydrograph method. When compared with inflow hydrographs inferred from reservoir records, the analyst judged the fit adequate.
- Baseflow method. The analyst did not include baseflow in the model.
- The PMF represents runoff from the most severe combination of critical meteorologic and hydrologic conditions for the watershed. During such events, travel times tend to be significantly shorter. Consequently, it is common to adjust unit hydrograph parameters to "peak" the unit hydrograph (USACE, 1991), increasing the maximum runoff and shortening the runoff time. As a general rule of thumb, reservoir inflow unit hydrographs for PMF determinations have been peaked 25 to fifty percent. The analyst here did so, after reviewing observed runoff hydrographs from other severe storms in the region. Ultimately, the analyst shortened Tc and reduced R to achieve a unit hydrograph peak approximately fifty percent greater than that found with the original best-estimates of the parameters. The values selected for PMF analysis were Tc = 2.0 hours and R = 4.6 hours. The analyst selected a fifteen-minute simulation time interval, consistent with this estimated time of concentration.
Boundary Condition: PMP Development
The NWS has developed PMP calculation procedures for all regions of the United States in Hydrometeorological Reports (HMR). For example, the eastern United States is covered by HMR No. 51 (NOAA, 1978) and No. 52 (NOAA, 1982). Because this is such a large area with many USACE projects, HEC incorporated the HMR 52 procedure directly within HEC-HMS, including an optimization option than can be used to identify critical PMP storm characteristics.
As the availability of data increases, the PMP estimates from NWS HMR may require adjustment in order to better define the conceptual PMP for a specific site. Therefore, it is appropriate to refine PMP estimates with site specific or regional studies performed by a qualified hydrometeorologist with experience in determining PMP; the analyst here turned to the local office of the NWS for assistance with this. PMP data provided by the meteorologist are given in the following table.
Duration (hr) | Depth (in) |
0.5 | 1.30 |
1 | 2.10 |
24 | 20.43 |
48 | 30.55 |
72 | 36.41 |
The PMP estimates were provided as a 72-hour storm, divided into six-hour increments. These six-hour values can be arranged into a storm temporal distribution that is front-, middle-, or end-loaded. (Here, the analyst checked each temporal distribution, making runs with the rainfall peak at the center of the distribution and at the 33 and 67 percentage points. This analyst found the timing of the rainfall peak had little effect on the PMF peak discharge for this particular watershed. The maximum computed reservoir water surface elevation was the same for all cases. This may not be the case in other watersheds.)
The four six-hour intervals with greatest depth were grouped into a 24-hour sequence, and the remaining intervals were arranged as described below to complete definition of the rainfall event. Within the peak 24-hour sequence, the four six-hour values are distributed in an alternating block sequence, with largest values in the center.
For this watershed, the computation time interval selected was fifteen minutes, so depths for durations shorter than six hours and for intervals less than six hours are needed. To develop these, the analyst plotted the logarithms of depths and durations, as shown in the following figure, and interpolated for intermediate durations. Some smoothing of the plotted function was required. Interpolated depths are shown in the following table. 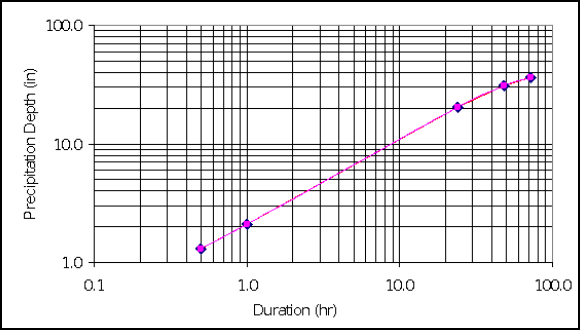
Duration (hr) | Depth (in) |
0.25 | 0.81 |
0.5 | 1.30 |
1 | 2.10 |
2 | 3.48 |
3 | 4.65 |
6 | 7.67 |
12 | 12.63 |
24 | 20.80 |
48 | 30.55 |
72 | 36.41 |
96 | 42.00 |
The analyst used the Frequency Storm precipitation method to create the PMP hyetograph. The Component Editor, which is shown in the following figure, does not permit entry of a 72-hour rainfall depth, so depth for a duration of 96 hours (four days) was estimated and entered. The peak volume stored in the reservoir is a function of the PMF peak discharge. A two-day event could have been selected rather than the four-day event. The two-day event would yield the same peak discharge, stage, and volume of water in the reservoir.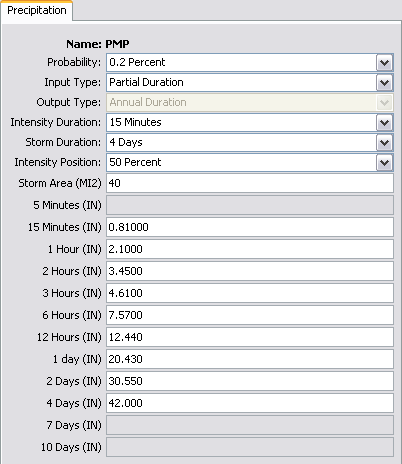
Reservoir Model
In addition to the model of runoff, the analyst also developed a model of the reservoir and dam in HEC-HMS. The resulting basin model is shown below. 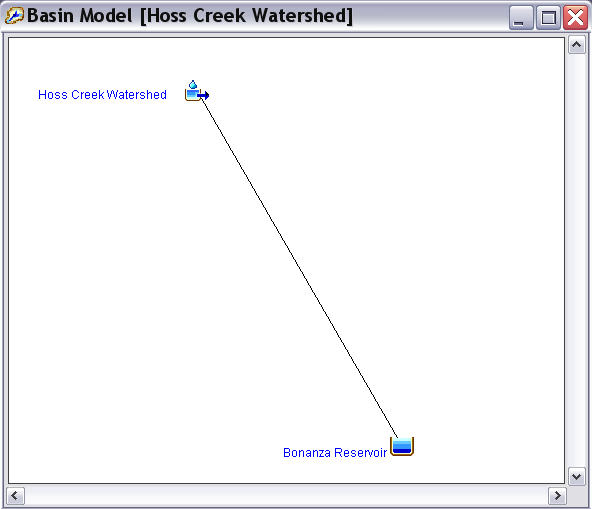
The following table shows the elevation-storage curve for Bonanza Reservoir. The existing spillway crest is at elevation 4,184 feet and the crest length is 175 feet. This information was found in the original design documents. However, if the data had not been available, the elevation-volume relationship would be developed from topographic and bathymetric surveys.
Elevation | Reservoir Storage |
3,900 | 0 |
4,100 | 31,400 |
4,184 | 123,300 |
4,185 | 124,680 |
4,186 | 126,300 |
4,187 | 127,950 |
4,188 | 129,650 |
4,189 | 131,420 |
4,190 | 133,150 |
4,191 | 135,000 |
4,192 | 136,700 |
4,195 | 141,800 |
In this analysis, the analyst consulted dam-safety regulations followed by the state. Per these regulations, any low level outlets through the dam are assumed not operable, and all out flow from the reservoir must pass over the spillway. The analyst also considered the possibility of tail water control. However, because all flow would pass over the elevated spillway, tail water was not a factor.
The reservoir was modeled using the Outflow Structures routing method. The elevation-storage curve shown in the previous table was used along with a spillway outlet. The spillway outlet was modeled using a Broad-Crested Spillway with a spillway crest elevation at 4,184 feet, a spillway length of 175 feet, and a discharge coefficient of 3.2.
Initial Conditions
The analyst had to select two initial conditions for the analysis: (1) the initial state of the watershed, and (2) the initial state of the reservoir. For the first condition, the analyst reasoned that the watershed was likely to be saturated when an extreme event occurred, and thus set the initial loss equal to 0.00 inches. For the second condition, the analyst consulted state dam safety regulations and found that these specified that the initial reservoir water surface elevation should equal the spillway crest elevation. Thus spillway flow is initiated with inflow. This conservative initial condition was accepted and implemented by specifying Initial Elevation of 4,184 feet in the reservoir Component Editor.
Application
The HEC-HMS model was completed, and the event simulated. A peak spillway discharge of 13,300 cfs was computed. The maximum water surface elevation in the reservoir was 4,192.3 feet. Top of the dam is at 4,192 feet, this means that the dam would be overtopped by the event. In addition, the analyst recognized that if precipitation depths were underestimated, if the unit hydrograph was not peaked adequately, or if the reservoir performance was modeled a bit optimistically, the pool elevation, in fact, would be greater. Further, the analyst knew that other factors, such as wind-driven waves, could well increase the pool elevation even more.
Research revealed that local dam safety regulations require a minimum difference of 1.5 feet to account for uncertainty in estimates. Thus the dam was considered unable to pass reliably the spillway design event.
Because the current configuration of the spillway did not pass safely the PMF, the analyst formulated an alternative design. This design increases the reservoir outflow capacity with an unlined auxiliary spillway in a low area on the ridge near the west abutment of the dam. Below is a schematic of the proposed design. Water discharging over this auxiliary spillway will be carried to Hoss Creek at a point about 1,000 feet downstream from the dam in order to avoid endangering the dam.
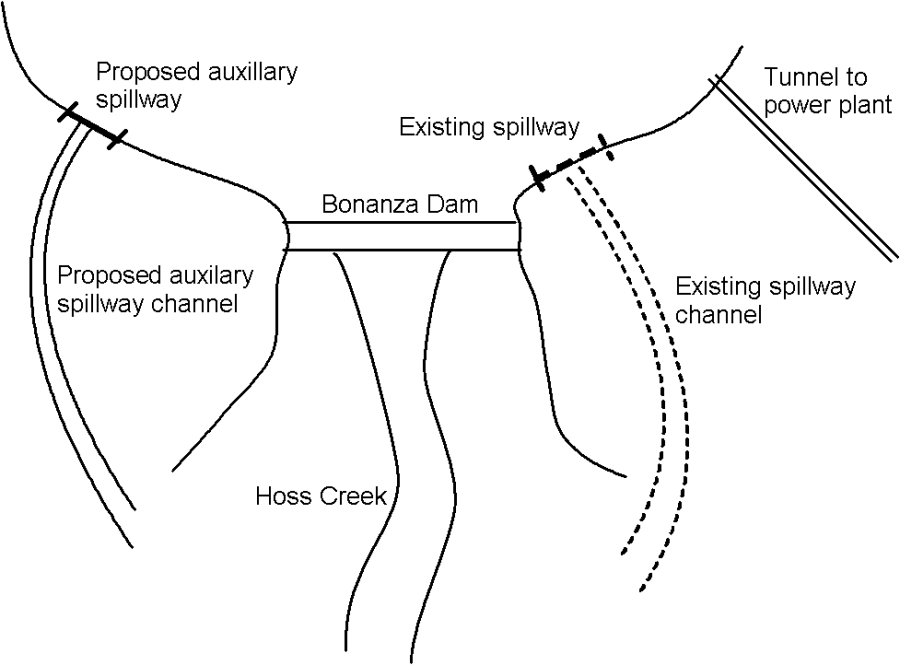
At the inlet, the auxiliary spillway would have a rectangular section. The maximum width possible is 300 feet; this is constrained by geological formations at the dam site. The optimal depth, presumably, will be the minimum depth, as the rock must be removed to create the spillway channel. The analyst found this depth by iteration as follows:
- An additional spillway was added to the reservoir element. The additional spillway was modeled using a Broad-Crested Spillway, with a length of 300 feet and a discharge coefficient of 3.2.
- A candidate auxiliary-spillway crest elevation was proposed.
- A simulation run was computed with the new auxiliary spillway. As before, the analyst specified an Initial Elevation equal to 4,184 feet, indicating that the reservoir is initially full.
- If the resulting maximum pool elevation was not at least 1.5 feet below the elevation of the top of dam, the crest elevation was lowered slightly, and Steps 2 and 3 were repeated.
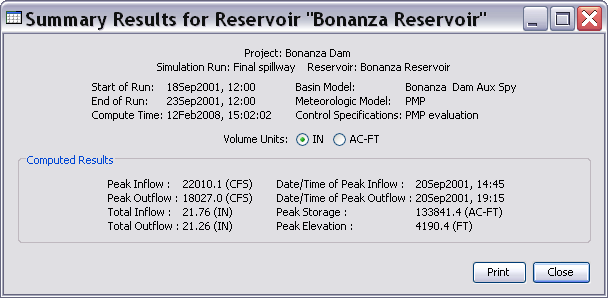
The following table shows the existing and auxiliary spillway characteristics for Bonanza Dam. This crest elevation for the auxiliary spillway satisfied the criterion for freeboard. The maximum reservoir water surface elevation was 4,190.4, as shown in the following figure; this is 1.6 feet below the top of the dam.
Spillway | Elevation | Length | Discharge Coefficient |
Existing | 4,184 | 175 | 3.2 |
Auxiliary | 4,186 | 300 | 3.2 |
