Download PDF
Download page Task 3: Debris Yield Modeling with Debris Basin (with New Debris Volume Conversion to Mass with Unit Weight/Density).
Task 3: Debris Yield Modeling with Debris Basin (with New Debris Volume Conversion to Mass with Unit Weight/Density)
Last Modified: 2023-10-25 14:49:23.445
Overview
The last two workshops looked at different erosion methods for estimating debris yield and strategies to calibrate the debris yield given measured debris yield volume. Watersheds such as Brand Canyon regularly produce sediment and large debris that can potentially cause damage or create blockages downstream to roads and structures. Debris basins are added at the mouth of a canyon to keep large sediment material from moving downstream. Debris yields can significantly increase after a fire making debris basins important components to reducing flood and debris risk. In HEC-HMS version 4.10, the Reservoir Capacity Method was added to the reservoir element which adjusts the the reservoir storage and area as sediment enters and deposits in the reservoir.
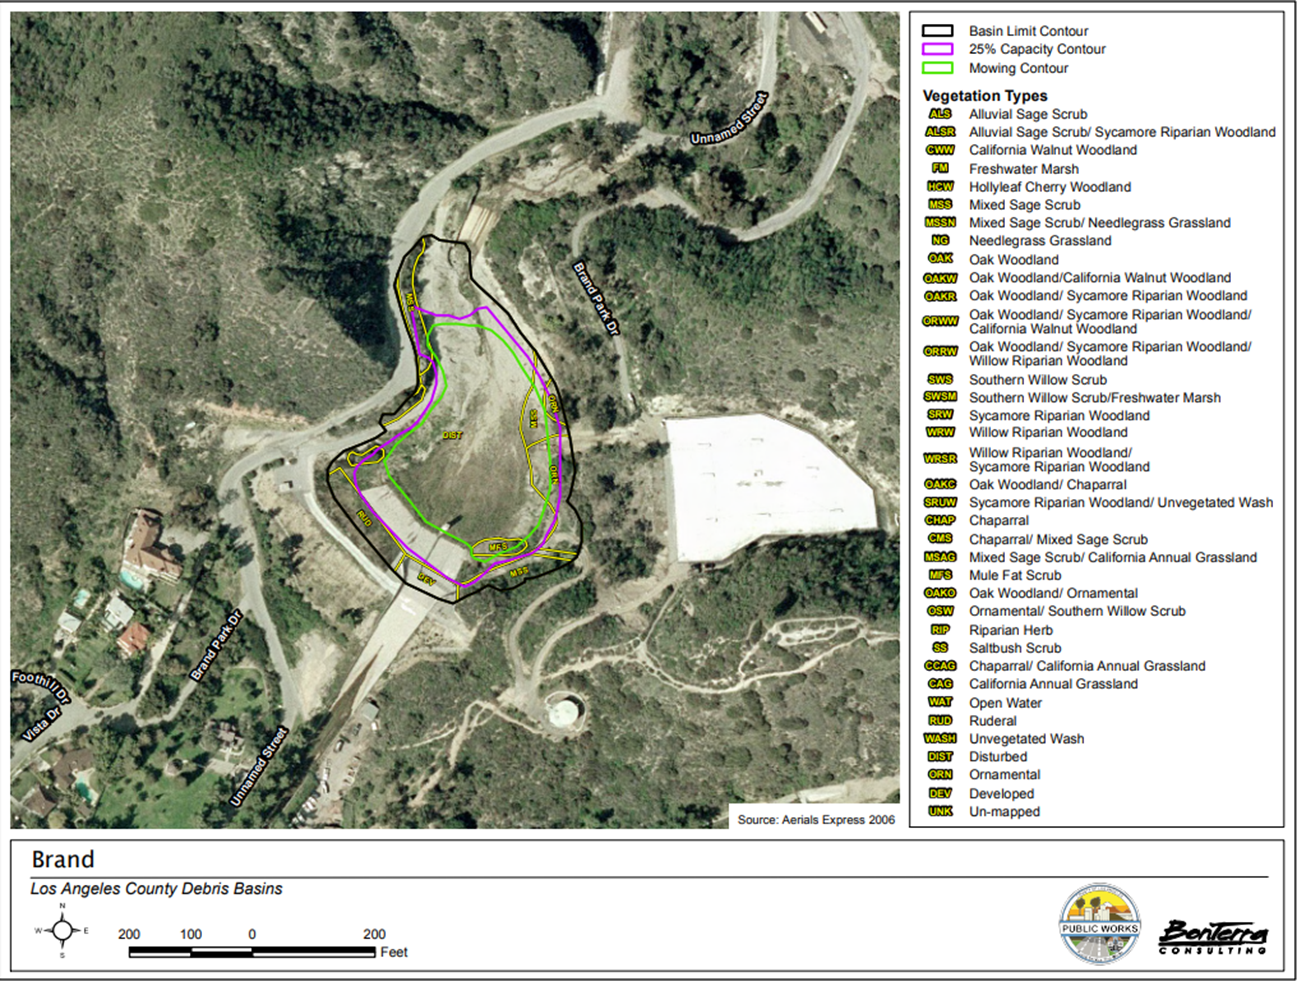
We will continue to build upon the Brand Canyon HMS model and see how you can model a debris basin in HEC-HMS. The image below shows the Brand Canyon debris basin. The debris basin has a storage capacity of approximately 155,000 m3. The debris basin contains a spillway to allow water and suspended sediment to move downstream. However the intake tower was not included in this model because the intake tower outlet structure option was not implemented yet in HEC-HMS. Debris basins and their functions are described more here.
Data
Download the initial model files here: Debris Yield Workshop with DB - Existing Model_Initial.zip
Set up the Erosion Method
- Launch HEC-HMS (version 4.12 beta 1 or later). Open the project and select the HEC-HMS project Brand_Debris_Basin.hms. Select the Basin Models folder to expand the Watershed Explorer and see all basin models in this project. You should notice a separate basin model for each debris yield method (LAEQ1, MSDPM, USGS_EA, and USGS_LT). The first Basin Model, named Brand_Canyon_LAEQ1, was prepared as a case study to define the initial set of model parameters and the final set of model parameters to be used in the debris yield simulation with the debris basin. The last three basin models were prepared as additional tasks for users who have more interested in the other three debris yield methods.
- Based on your answer from Task 2 Question 5, use the method that you think works best for this modeling application. The following steps are for Brand_Canyon_LAEQ1 Basin Model.
- Select the Brand_Canyon subbasin element.
- On the Subbasin tab, change the Erosion Method to LA Debris Method EQ1.
- Calculate Relief Ratio by selecting Parameters | Characteristics | Subbasin.
- Select the Erosion tab and populate the Erosion parameters based on the given field data shown below.
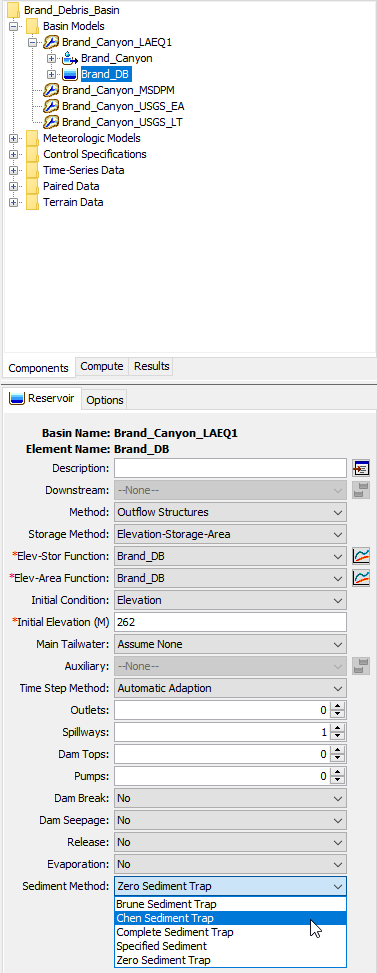
Parameter (metric) Value A-T Factor 1 Relief Ratio 216.19 Fire Factor Method Pak & Lee Fire Factor Date 02Sep2002 Percent 90 Flow Threshold 1.7 Exponent 1 Gradation Curve Debris Flow Mixture - Select the Brand_DB reservoir element. This reservoir element was setup using the following field data.
Parameter (metric) Value Method Outflow Structure Storage-Method Elevation-Storage-Area Elev-Stor Function Brand_DB Elev_Area Brand_DB Initial Elevation 262 Main Tailwater None Time Step Method Automatic Adaption Spillways 1
Set up the Sediment Method in the Reservoir Element
- On the Reservoir tab, change the Sediment Method to Chen Sediment Trap. The Chen Sediment Trap method is preferred over Brune Sediment Trap Method for this application since the Brune Method requires an Annual Inflow Volume. The Brune Sediment Trap method is better suited for basins with perennial flow.
- Chen Sediment Trap computes a trap efficiency by using the equation below.
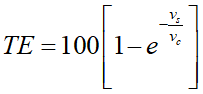
Vs is the settling velocity of the soil particle and Vc is the critical settling velocity. The settling velocity of the soil particle, Vs, can be selected from the Basin Model where you defined the density for each sediment type. For this workshop, use the Rubey Fall Velocity method. The fall velocity method is not sensitive since the debris basin is small and sediment deposition happens quickly. For larger reservoirs, the Fall Velocity can be a sensitive parameter. More information on the Fall Velocity equations is described here: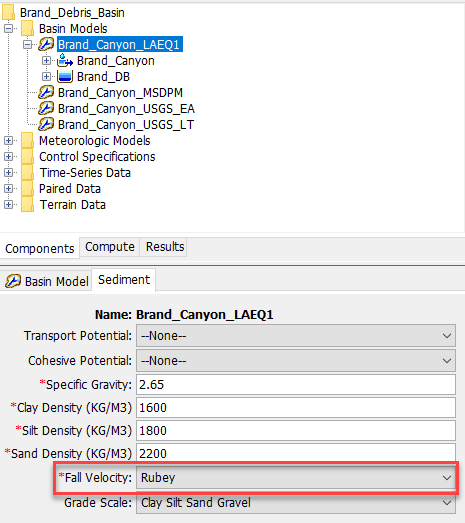
- Chen Sediment Trap computes a trap efficiency by using the equation below.
- Navigate back to the Reservoir element and select the Sediment Tab.
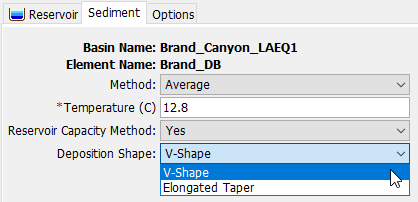
- Select Yes for the Reservoir Capacity Method. Setting the option to Yes will allow the sediment reservoir capacity to update as sediment is deposited in the reservoir.
- Select V-Shaped for the Deposition Shape. The V-Shape method assumes sediment deposition will all occur at the bottom of the debris basin.
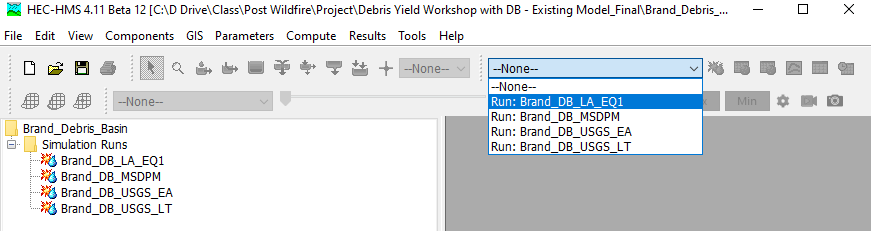
- Run Brand_DB_LA_EQ1 by selecting Run: Brand_DB_LA_EQ1 then click the raindrop icon
 .
.
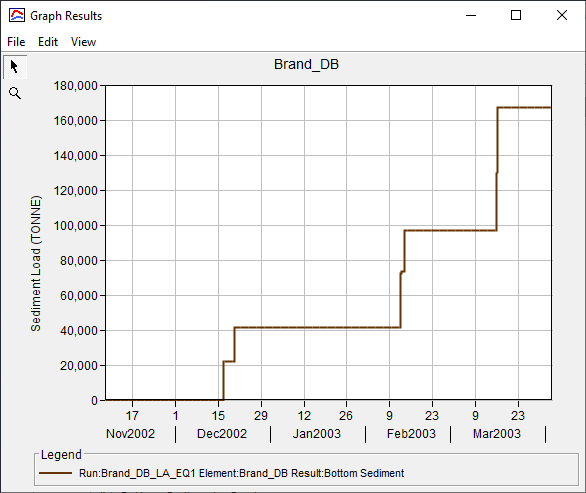
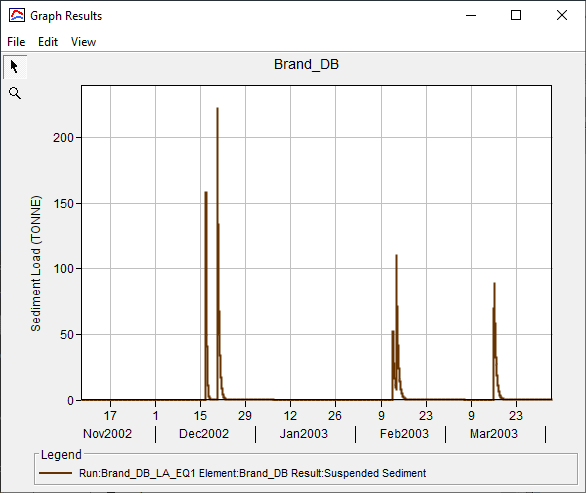
- Navigate over to the Results tab and expand the Brand_DB reservoir element. Expand the Sediment folder. You should notice some additional results for sediment deposition and suspended sediment
- Bottom Sediment reflects the accumulated sediment deposition during the simulation.
- Suspended Sediment reflects the sediment remaining in the water column. Suspended sediment that does not leave the system gets recalculated into the sediment trap compute.
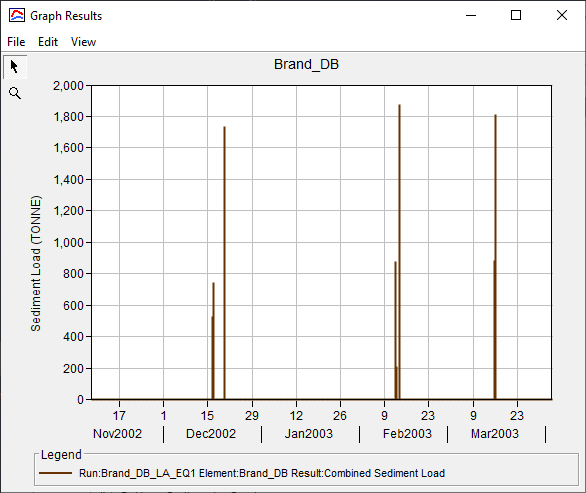
- Combined Sediment Load and Combined Sediment Volume reflects the incoming sediment inflows. This will be the same as the sediment load computed from the subbasin element.
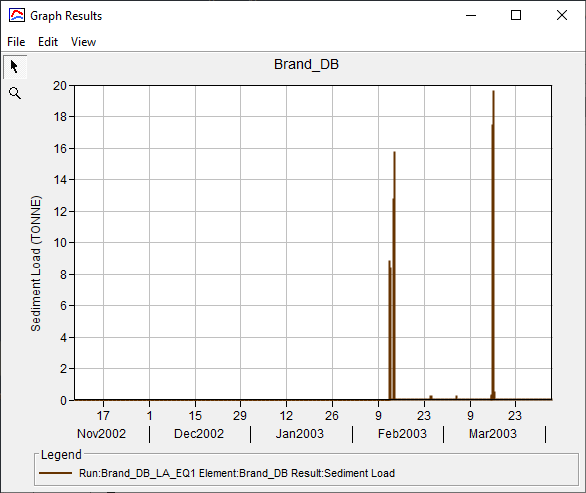
- Sediment Load and Sediment Volume reflects the outgoing sediment. Only the suspended sediment will leave the reservoir.
- Bottom Sediment reflects the accumulated sediment deposition during the simulation.
Review the Erosion Parameters
In Task 2, the sediment volume represented the total debris volume from the basin. With a debris basin, not all of the debris will deposit in the reservoir. Some of the sediment will stay in suspension and move out of the reservoir as shown in the Sediment Load figure above. We will review the output for deposited sediment and determine whether there is a need to re-calibrate the erosion parameters again.
Question 1: Which of the computed Results should we consider using to compare against our measured volume?
We want to look at the Bottom Sediment results and the values at the end of the simulation which represents the total accumulated sediment.
- Select Bottom Sediment - Silt from the Results tab and click on the Time Series Results to the right of the Results toolbar. The Time Series Results table will open.
- Scroll all the way down to April 3, 2003 and record the value in tonnes. This value needs to be converted into volume.
- Head over to your project folder and open the Task 3_Measured Data.xlsx spreadsheet (\Debris Yield Workshop with DB - Existing Model_Initial\previously_created_data).
- Enter your values in tonnes for silt, sand, and gravel.
- If needed, adjust your erosion parameters until your simulated values are near the measured volume.
Question 2: How to the computed deposited volumes compare with the computed total debris volume?
Answers will vary for different erosion methods. For the LA Equation 1 erosion method, the computed deposited sediment is only slightly less than the total sediment computed from the basin.
Computed Total Sediment = 76,756 m3
Bottom Sediment = 76,094 m3
The difference is negligible. This indicates most of the sediment is trapped by the debris basin and settles to the bottom (High Trap Ratio). Only a small fraction of the suspended sediment leaves the reservoir and moves downstream.
Review Elevation-Storage and Elevation-Area curves
- By using the Reservoir Volume Reduction method, Elevation-Storage and Elevation-Area curves will update as a result of the deposited sediment. These curves will update at every timestep when sediment is deposited. The elevation-storage and elevation area curves for Brand_DB reservoir element are saved in the project DSS file and are only saved for the beginning of the simulation, the last day of the each month, and the end of the simulation (not every time step is saved).
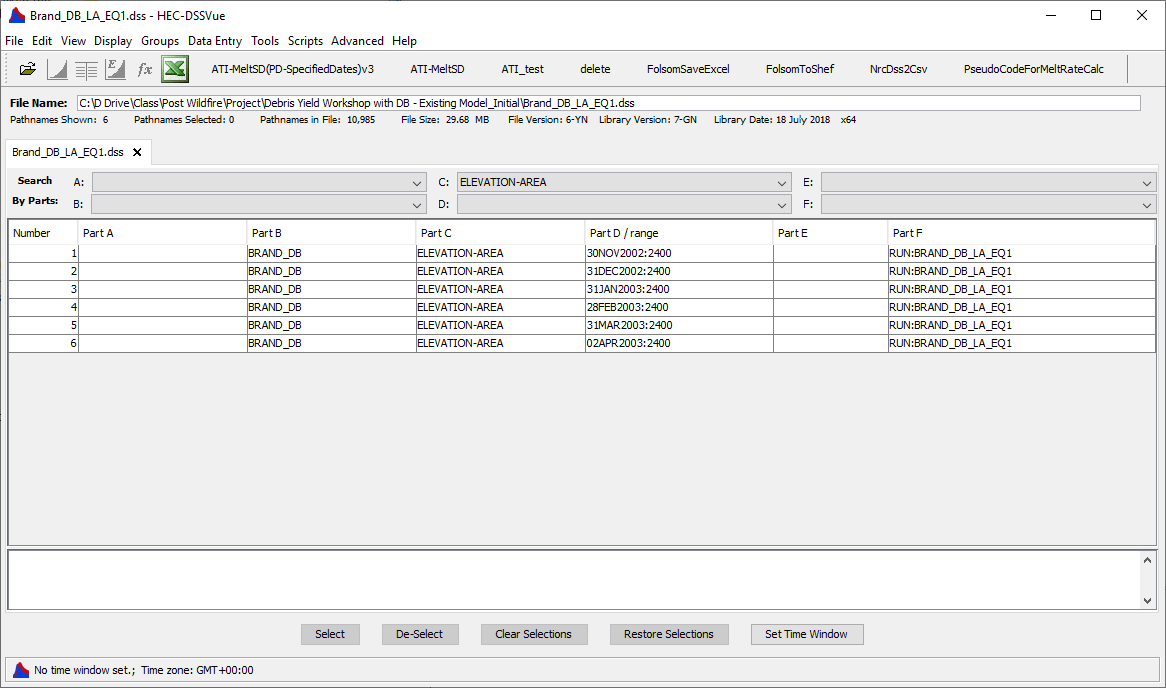
- To view the elevation-storage and elevation-area curves, go to your project folder. For those who used the LA equation 1 method, open the output DSS file Brand_DB_LA_EQ1.dss.
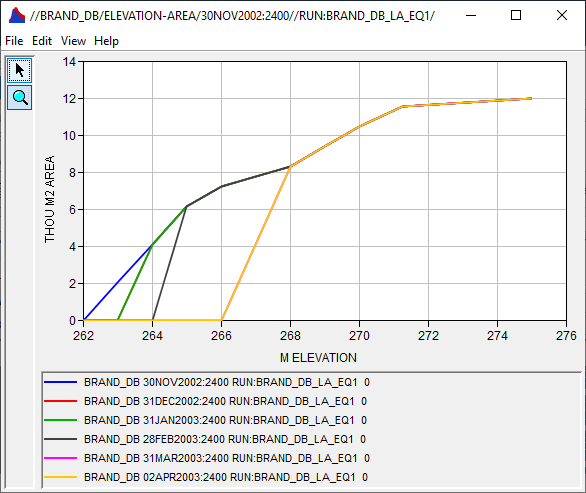
- Filter the Part C to Elevation-Area. You should see six records spanning from November 2002 to April 2003. The November record is the original elevation-area curve.
- Highlight all six records and graph the results. This shows the change in the elevation-area curve over time. From the end of December to the end of January, there was not much sediment deposited to remove the debris basin area. This matches the Bottom Sediment graph. From February to March, enough sediment is deposited to remove area from the debris basin. Note that the bottom elevation of the debris basin changed from 262 to 266 meters due to sediment storage.
- Head back to the DSS results file and switch the Part C to Elevation-Storage. You should see six records from November to April. Highlight the records and graph the results. These results show the change in storage over the simulation period.
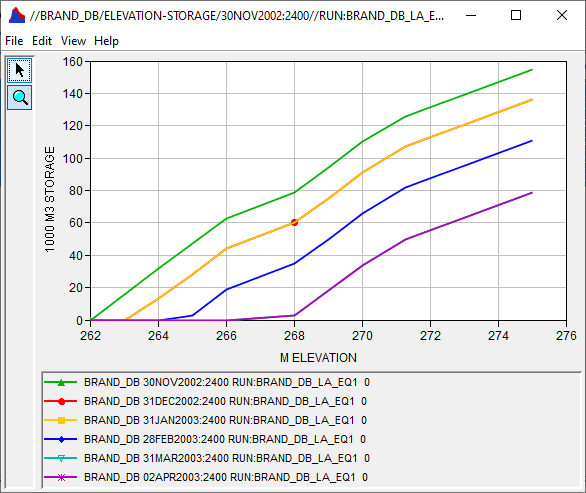
Question 3: How much storage is lost?
Answers will vary for different erosion methods. 155,000 m3 - 78,905 m3 = 76,095 m3 of storage was lost. Remaining Debris Basin Capacity: 78,905 m3/155,000 m3 X100 = 51%
Question 4: How can this method be used to clean out debris basins?
In addition to estimating how much debris yield to expect, for regions with multiple debris basins, this method can be used to determine which debris basins to prioritize debris removal. Frequency of clean out per debris basin can also be estimated.
Question 5: For larger reservoirs, what assumptions and methods would we need to revisit?
The Deposition Shape is using the V-Shape method which deposits all sediment to the bottom of the reservoir element. The Elongated Taper method should be considered for larger reservoirs which deposits larger sediment (sand & gravel) at the surface of the reservoir and smaller sized sediment (clay & silt) at the bottom of the reservoir.
The Temperature of the reservoir was assumed to use an average value. This should probably change for larger reservoirs as temperature has an affect on the Fall Velocity.
Review different Fall Velocity methods to see which method might work best for your reservoir.