Download PDF
Download page Introduction to the Loss Rate Tutorials.
Introduction to the Loss Rate Tutorials
Last Modified: 2023-11-02 05:59:03.325
Precipitation Losses
Precipitation losses to surface components involve the interaction of multiple processes at different scales. The most basic process is infiltration of water into an ideal soil with uniform properties and infinite depth. Initially, the soil is assumed to be uniformly saturated. Once precipitation begins, water is infiltrated until rainfall exceeds the infiltration capacity of the soil. At this point, excess precipitation is formed on the surface and subject to direct runoff computations. As the volume of infiltrated water increases, the infiltration capacity decreases to a minimum rate which is equivalent to the soil’s saturated hydraulic conductivity, as shown in the figure below.
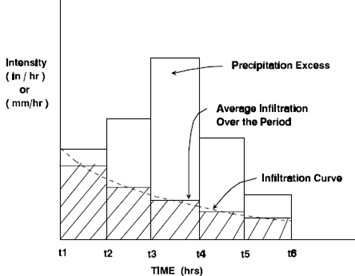
The flow of water in either saturated or unsaturated soil can almost always be described by Darcy's Law. Darcy's Law states the vertical flow of water is proportional to the potential gradient. When the spatial coordinate is taken as zero at the soil surface and measured downward, Darcy's Law can be stated in the following form:
v=-K\left(\frac{d \psi}{d z}-1\right)
where ν is the flow per unit area, ψ is the matric potential (a negative value), z is the spatial coordinate (measured positive downward), and K is the hydraulic conductivity. If the soil is saturated, then K is the saturated hydraulic conductivity and is a function of the soil properties and the water properties. For unsaturated conditions, the conductivity is still a function of soil and water properties, but is additionally a function of the matric potential. As the water content decreases from saturated toward the residual content, the matric potential becomes increasingly negative. The relationship between conductivity and matric potential is nonlinear resulting in the magnitude of the conductivity varying by several orders of magnitude over the possible range of water content. Darcy's Law is part of the derivation of all physically based models of infiltration and is also used on many conceptual models.
However, not all precipitation losses are due to soil infiltration alone. Interception of precipitation by a vegetation canopy or surface depressions (ponding) can reduce the amount of precipitation that will either runoff or be infiltrated. Also, once water is in the soil, a portion that was infiltrated may return to the atmosphere through evapotranspiration. Users are directed to the HEC-HMS Technical Reference Manual and HEC-HMS User's Manual for further information regarding the available canopy and surface methods.
Tutorial Overview
In this workshop, you will become familiar with several loss methods that are available within HEC-HMS. Specifically, you will:
- Estimate initial parameter values throughout the study area using GIS information.
- Enter the initial parameter values within a basin model, create a simulation run, and compute the simulation.
- Calibrate the initial parameter values to achieve a better fit to the observed data.
- Repeat for additional loss methods.
- Compare and contrast the differences between each method.
Questions will be provided throughout each tutorial.
Background
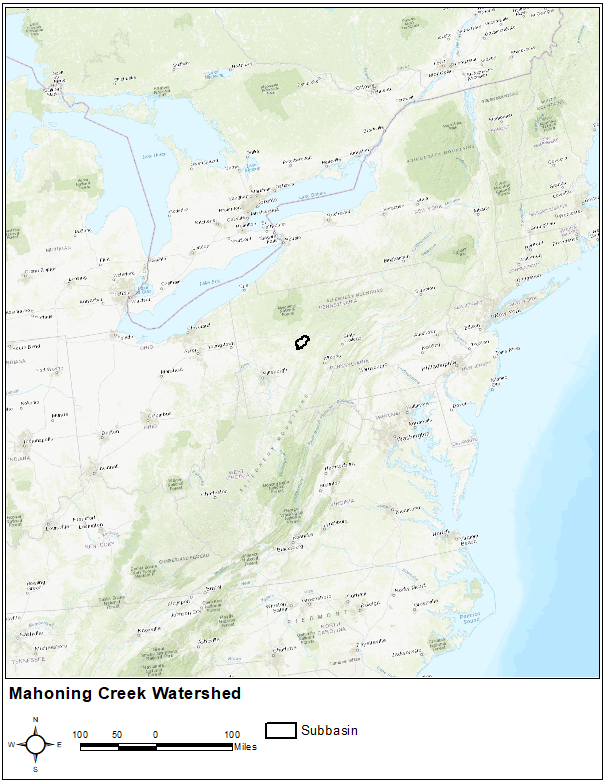
In this tutorial group, the study area is designated as the Mahoning Creek watershed upstream of the town of Punxsutawney, PA. Mahoning Creek is part of the Allegheny River Basin and is located in western Pennsylvania, as shown below.
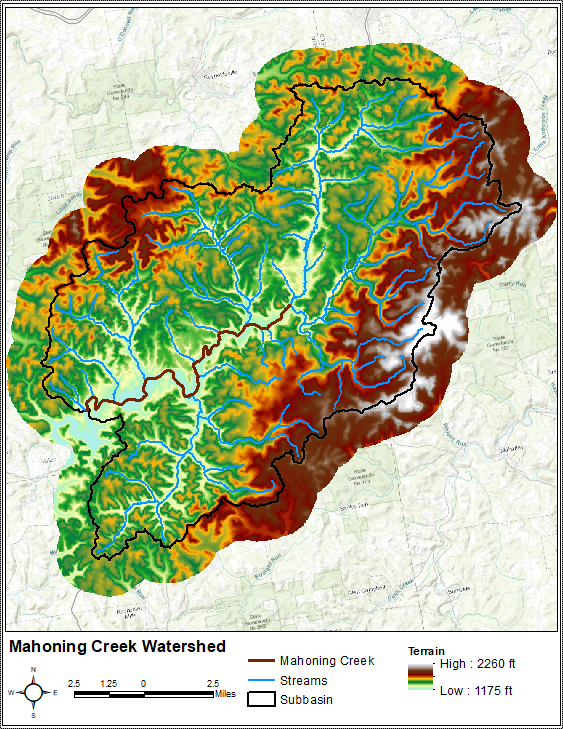
The primary conveyance system of this 158 sq. mi. study area includes the following major streams: Stump Creek, East Branch Mahoning Creek, and Mahoning Creek. The confluence of Stump Creek and East Branch Mahoning Creek is located east of the enclave of Big Run. Mahoning Creek is downstream of the confluence. Elevations within the study area range from approximately 1175 ft to 2260 ft as referenced to the North American Vertical Datum of 1988 (NAVD88), as shown below.
Data
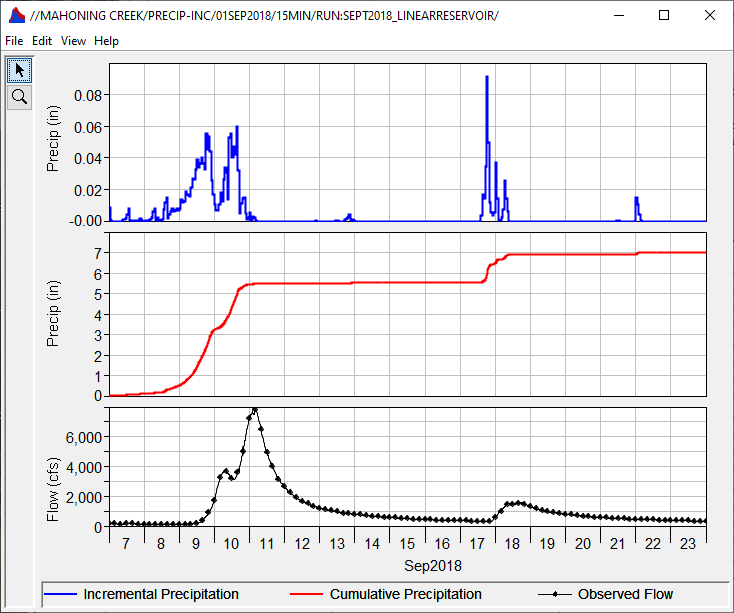
A 17-day time period in September 2018 will be simulated within this tutorial. During this time period, the remnants of Hurricane Florence passed through the study area and brought heavy rainfall and subsequent flooding.
Precipitation
Multi-Radar/Multi-Sensor System (MRMS) gridded precipitation will be used as the boundary condition for all simulations within this tutorial. The MRMS gridded dataset has a native spatial resolution of 1 kilometer x 1 kilometer and a time step of 1-hour. The raw data files were ingested, projected, and output in DSS format using the HEC Vortex suite of tools. The time zone of this data is Coordinated Universal Time (UTC).
Streamflow
Both stage and flow data is recorded by the U.S. Geological Survey (USGS) at Punxsutawney and stored within the National Water Information System (NWIS). The location of this stream gage is shown below. The outlet of the study area within the provided HEC-HMS project is co-located with this gaging station.
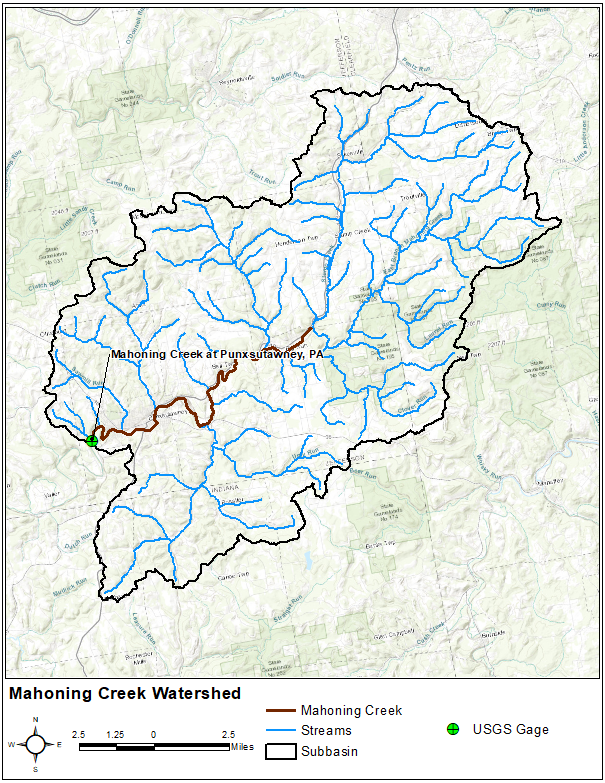
15-minute observed streamflow data was imported from NWIS using HEC-DSSVue. The data was then shifted +5 hours to align with the previously-mentioned MRMS data (i.e. UTC). The figure below shows the basin-average precipitation for the study area and observed streamflow data for the Mahoning Creek at Punxsutawney gage for the simulation time period.
Model Configuration
An HEC-HMS project named "Punxsutawney" has already been created for you. This HEC-HMS project contains a basin model named "Mahoning Creek", a meteorologic model named "MRMS", and a control specification named "September 2018". As shown in the figure below, there is one subbasin element named "Mahoning Creek" which is connected to a sink element named "Mahoning Creek Gage at Punx" within the existing basin model. This subbasin was originally delineated using terrain data downloaded from the USGS National Map Viewer.
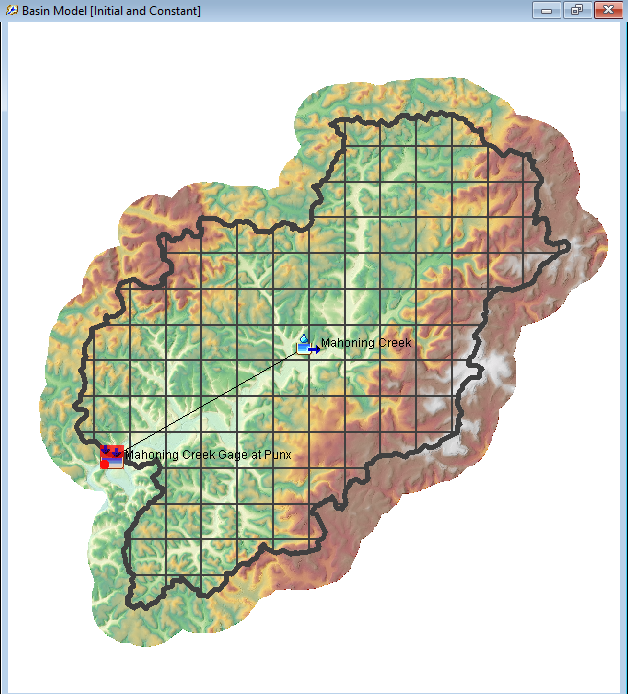
The subbasin element was configured to use a 2000-meter SHG Structured discretization, the Simple canopy method, the Clark unit hydrograph transform method, and the Recession baseflow method. The previously-mentioned observed discharge record from the Mahoning Creek at Punxsutawney gage was linked to both the subbasin and the sink elements.
Continue to Applying the Initial and Constant Loss Method.