Download PDF
Download page Applying the Muskingum Routing Method.
Applying the Muskingum Routing Method
Return to Applying the Lag Routing Method
HEC-HMS version 4.13-beta.4 was used to create this tutorial. You will need to use HEC-HMS version 4.13-beta.4, or newer, to open the project files.
Download the initial project files here:
Note: The initial project file is the same for the Lag, Muskingum, and Muskingum-Cunge routing method tutorials. If you are completing all three tutorials, the files only need to be downloaded once.
Overview
In this tutorial you will apply the HEC-HMS Muskingum channel routing method to a modeling application. Initial parameter estimates will be estimated using GIS and observed information and the model will be calibrated through trial and error.
Background
The Muskingum routing method uses a conservation of mass approach to route an inflow hydrograph. The Muskingum method can also account for “looped” storage vs. outflow relationships that commonly exist in most rivers (i.e., hysteresis). As such, this method can simulate the commonly observed increased channel storage during the rising side and decreased channel storage during the falling side of a passing flood wave. To do so, the total storage in a reach is conceptualized as the sum of prism (i.e. rectangle) and wedge (i.e. triangle) storage, as shown in Figure 1. During rising stages on the leading edge of a flood wave, wedge storage is positive and added to the prism storage. Conversely, during falling stages on the receding side of a flood wave, wedge storage is negative and subtracted from the prism storage. Through the inclusion of a travel time for the reach and a weighting between the influence of inflow and outflow, it is possible to approximate attenuation.
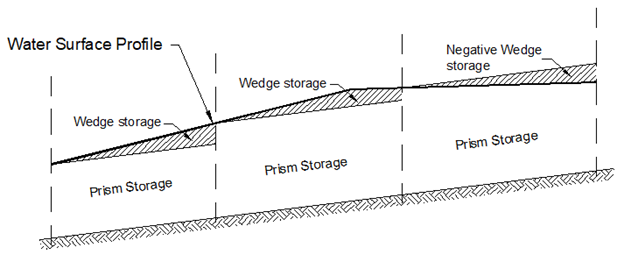
Parameters that are required to utilize this method within HEC-HMS include the initial condition, K [hours], X, and the Number of Subreaches.
Estimate Initial Parameter Values
K
The Muskingum K parameter is equivalent to the travel time through the reach. This parameter can be estimated in multiple ways including:
- Using known hydrograph data.
- Comparing flow length to a flood wave velocity.
- Using regression equations which were developed from observed data in a similar region.
Using Known Hydrograph Data
The travel time of a flood wave moving through a reach can be estimated by taking the difference between "similar points" on known inflow and outflow hydrographs. The similar points can be the peaks of either hydrograph, the centroid of the area underneath each hydrograph, or between some reference flow on the rising limb of either hydrograph. The inflow and outflow hydrographs for this tutorial are shown and detailed within Figure 2.
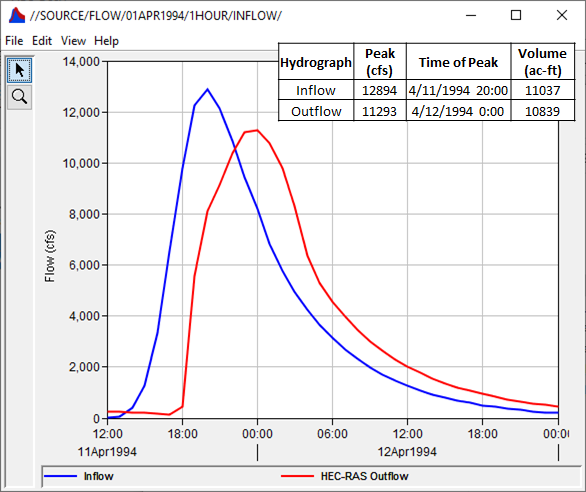
Use Figure 1 to answer the following questions.
Question 1: Use the time of peak for both hydrographs shown in Figure 2 to estimate a representative travel time (in hours) for this event.
The inflow and outflow time of peak are 4/11/1994 20:00 and 4/12/1994 00:00, respectively. The difference in time between these two points is 4 hours.
Question 2: Use the approximate centroid of the area beneath each hydrograph to estimate a representative travel time (in hours) for this event.
The centroid of the area beneath the inflow hydrograph lies at approximately 4/11/1994 21:00. The centroid of the area beneath the outflow hydrograph lies at approximately 4/12/1994 00:00. The difference in time between these two points is 3 hours.
Question 3: For a reference flow of 6500 cfs on the rising limb, estimate a representative travel time (in hours) for this event.
The inflow hydrograph reaches 6500 cfs at approximately 4/11/1994 17:00. The outflow hydrograph reaches 6500 cfs at approximately 4/11/1994 19:30. The difference in time between these two points is 2.5 hours.
Comparing Flow Length to a Flood Wave Velocity
The travel time, T, of a flood wave moving through a reach can also be estimated by dividing the length of the reach, L, by the flood wave velocity, Vw:
T=\frac{L}{V_{w}}
To estimate a flood wave velocity, multiple approaches can be used including:
- Manning's Equation (Manning, 1891)
- Kleitz-Seddon Law (Seddon, 1900)
This tutorial will make use of the Kleitz-Seddon Law which can be written as:
V_{w}=\frac{1}{B} \frac{d Q}{d y}
where B = the top width of the water surface and \frac{d Q}{d y} = slope of the flow-stage rating curve; both of these variables must be estimated for the flow rate in question and at a cross section that is representative of the routing reach. The USGS maintains a flow-stage rating curve for the stream gage at Punxsutawney and is shown in Figure 3.
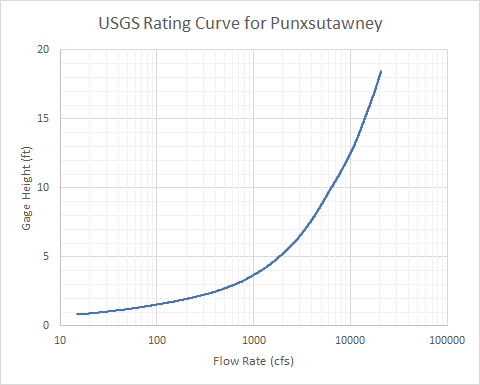
Use the previously-shown equations and Figure 3 to answer the following questions. Assume the following:
- The length of the reach within this example is 68860 feet.
- The slope of the rating curve shown in Figure 2 at a reference flow of 6500 cfs is approximately 1316 cfs / ft.
- The top width of Mahoning Creek in the vicinity of the Punxsutawney gage at a reference flow of 6500 cfs is approximately 200 ft.
Question 4: For a reference flow of 6500 cfs, estimate a representative flood wave velocity (in ft/s) using the Kleitz-Seddon Law.
V_{w}=\frac{1}{B} \frac{d Q}{d y}
V_{w}=\frac{1}{200 ft} * 1316 \frac{\frac{ft^3}{s}} {ft}
V_{w}=6.58 \frac{ft}{s}
Question 5: Using the previously-computed representative flood wave velocity, estimate a representative travel time (in hours) for this event.
T=\frac{L}{V_{w}}
T=\frac{68860 ft}{6.58 \frac{ft}{s}} * \frac{1 min}{60 sec} * \frac{1 hour}{60 min}
T=2.9 hrs
Question 6: Do you think a single, representative travel time can be estimated for both large and small flood events? Do you have any reservations about the use of a single value to represent the travel time through a reach?
Estimating a single, representative travel time for flood events large and small is difficult (if not impossible) in real world streams. In general, the speed at which a flood wave moves depends upon the depth of flow. For instance, within most stream systems, larger floods (with greater depths) propagate faster than smaller floods (which have shallower depths). Also, the speed at which a flood wave moves through a reach depends upon the geometry of the stream in question. Top width, flow area, effective roughness, and even the flow length (due to increasing/decreasing sinuosity) of a stream can change with the magnitude of an event. As such, the travel time through a reach depends upon the event and reach in question. Channel routing parameters, like travel time, must be calibrated and validated based upon the model's intended use.
X
The Muskingum X parameter is a dimensionless coefficient that lacks a strong physical meaning. This parameter must range between 0.0 (maximum attenuation) and 0.5 (no attenuation). When this parameter is set to a value of 0, storage within the reach is computed solely as a function of outflow. This is equivalent to level pool routing and results in the maximum possible amount of attenuation. When this parameter is set to a value of 0.5, equal weight is given to both inflow and outflow when determining storage within the reach. This results in no attenuation to the inflow hydrograph as it progresses through the reach. For most applications, an initial estimate of 0.25 is further refined through model calibration.
Number of Subreaches
The number of subreaches parameter affects attenuation. One subreach results in the maximum amount of attenuation and increasing the number of subreaches approaches zero attenuation. An initial estimate of this parameter can be obtained by dividing the Muskingum K parameter by the simulation time step, {\Delta t}:
\text { Number of Subreaches }=\frac{K}{\Delta t}
For natural channels that vary in cross-section dimension, slope, and storage, the number of subreaches can be treated as a calibration parameter. The number of subreaches may be used to introduce numerical attenuation which can be used to better represent the movement of flood waves through the natural system.
Question 7: Assuming a simulation time step of 15 minutes, use your answers to the previous questions in addition to the above equation to estimate the number of routing reaches for the event in question.
\text { Number of Subreaches }=\frac{K}{\Delta t}
\text { Number of Subreaches }=\frac{2.9 hours}{15 min} * \frac{60 min}{1 hour}
\text { Number of Subreaches }=~12
Modify the Existing HEC-HMS Project
Now that you've estimated initial parameters, begin modifying the existing HEC-HMS project.
- Open the Punxsutawney_Reach_Routing project and then open the Mahoning_Muskingum Basin Model.
- Select the Mahoning Creek reach element.
- Change the routing method to Muskingum.
- Select the Routing tab to open the Muskingum Component Editor.
- Make sure the Initial Type is set to Discharge = Inflow.
- Enter one of the previously-determined travel times within the Muskingum K entry field (in hours) that were estimated in the previous section, enter 0.25 within the Muskingum X entry field, and enter the previously-determined number of subreaches. The Muskingum Component Editor should resemble Figure 4.

- Create a new simulation run by clicking Compute | Create Compute | Simulation Run.
- Name the new simulation run "April1994_Muskingum".
- Select the Mahoning_Muskingum basin model.
- Select the NoRain meteorologic model.
- Select the April 1994 control specifications.
- Select the April1994_Muskingum simulation run from the Compute toolbar,
 .
. - Press the Compute All Elements button,
 , to run the simulation.
 - View the result graph,
 , and summary table,
  , for the Mahoning Creek reach element, as shown in Figure 5.
- Leave the summary table and plot open so you can see results change as you modify the routing method parameters.
- Notice the computed peak discharge, time to peak discharge, and discharge hydrograph shape differ from the observed data. This is confirmed within the summary table.
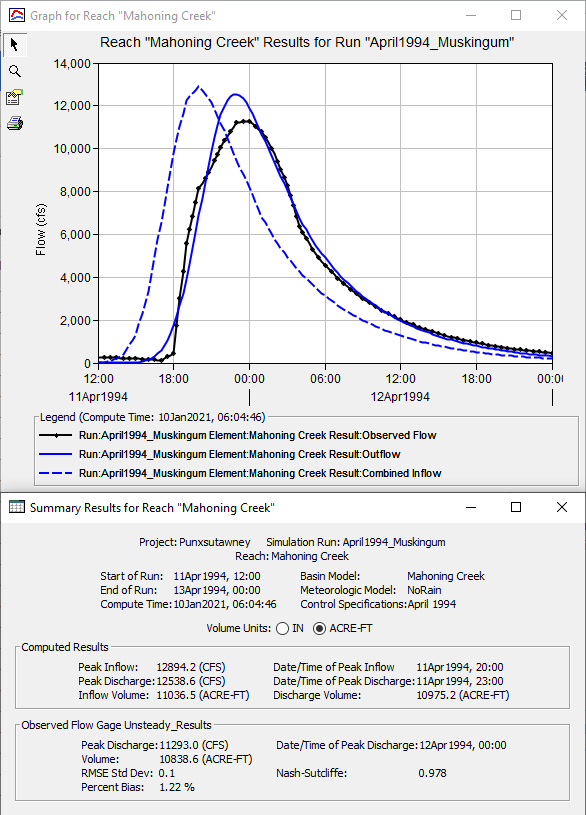
- To better match the observed discharge, the Muskingum routing method parameters must be calibrated.
Calibrate the Model
Calibrating a model to afford better agreement between computed and observed runoff oftentimes requires simultaneous changes to more than just one process (e.g. calibrate both transform and routing reach parameters at the same time). However, within this tutorial, only the Muskingum routing method parameters will be modified.
- Begin by modifying the routing parameters to approximately match the rising limb of the observed hydrograph.
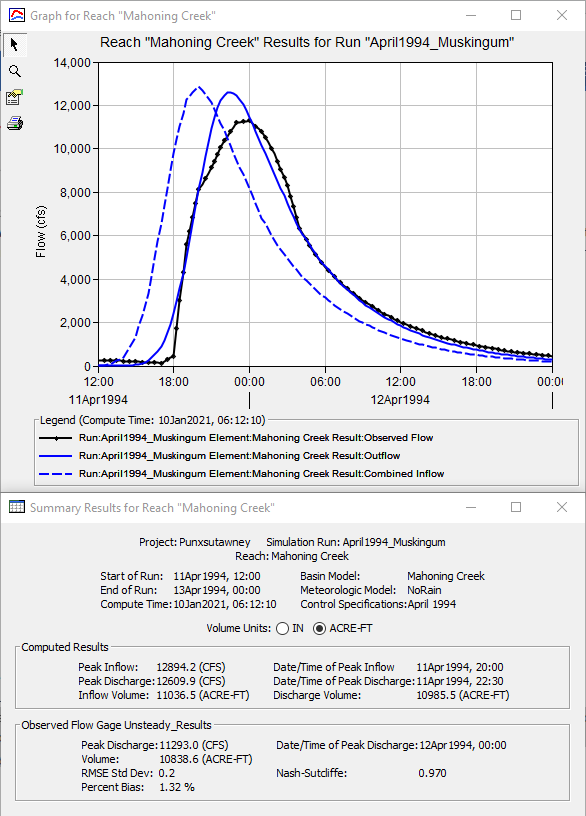
- Change the Muskingum K parameter to 2.5 hours and rerun the simulation.
- When looking at the result graph and summary table for the Mahoning Creek reach element, the computed hydrograph begins to rise at approximately the same time as the observed hydrograph, as shown in Figure 6. However, the computed peak discharge (12,610 cfs) is still greater than the observed peak discharge (11,293 cfs) so further modifications are required.
- Continue modifying the routing parameters to approximately match the peak discharge of the observed hydrograph.
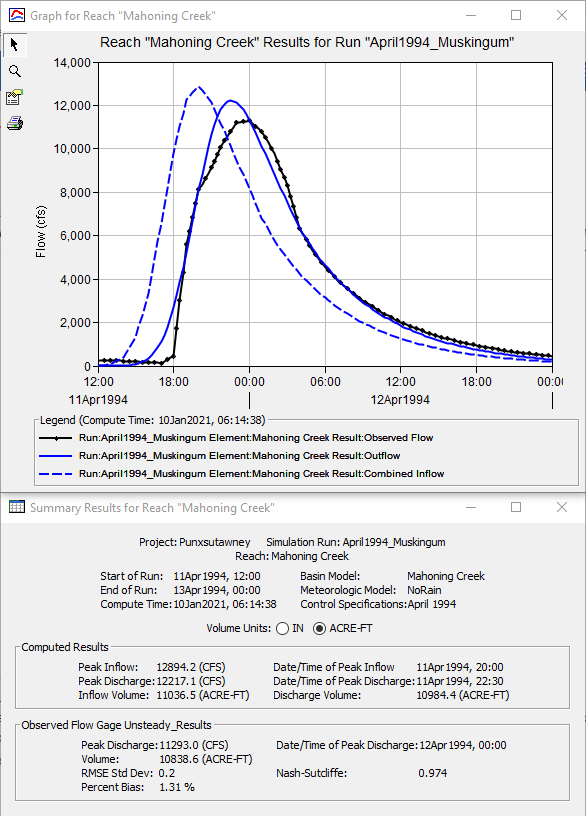
- Change the Muskingum X parameter to 0.1, change the number of subreaches to 6, and rerun the simulation.
- Notice that the computed peak discharge is now closer to the observed peak discharge (12,217 vs 11,293 cfs), as shown in Figure 7. However, the computed peak discharge is still greater and occurs sooner than the observed discharge hydrograph.
- Continue adjusting the Muskingum routing method parameters in an attempt to simultaneously best match the peak discharge flow rate, time of peak discharge, hydrograph shape, and discharge volume. Record the various differences between the computed and observed discharge hydrographs in addition to the RMSE Std Dev, Percent Bias, and Nash-Sutcliffe statistical metrics as you adjust model parameters.
Summary Questions
Question 7. What were the final Muskingum routing parameters and corresponding computed discharge peak flow rate, time of peak, and volume (in ac-ft) for the calibrated model? How do these values compare to the corresponding observed discharge values?
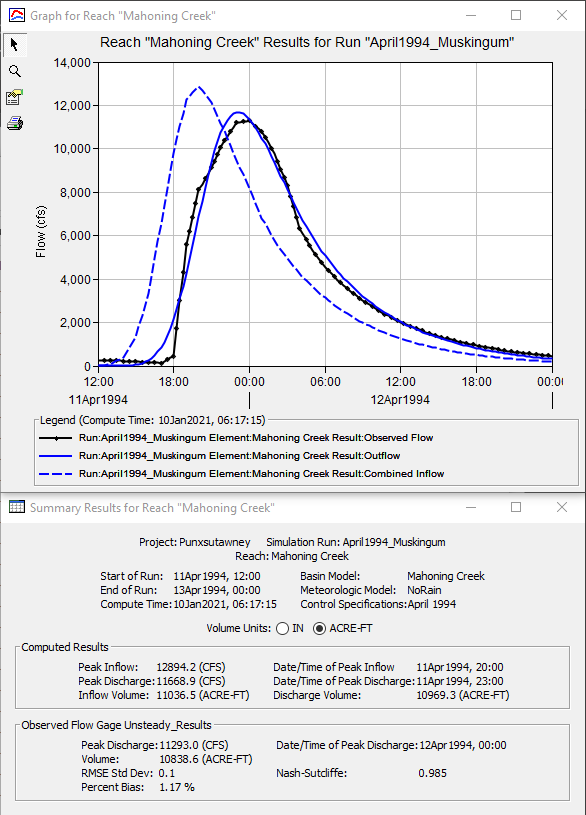
Using a Muskingum K of 3 hours, a Muskingum X of 0.2, and 3 subreaches results in a difference of approximately 376 cfs, 60 minutes, and 131 ac-ft when comparing the peak flow rate, time of peak, and volume of the computed and observed discharge hydrographs, respectively. Also, these parameters result in an RMSE Std Dev, Percent Bias, and Nash-Sutcliffe statistical metrics of 0.1, 1.17%, and 0.985, respectively, as shown in Figure 8. However, these are by no means the only parameter combinations that can result in acceptable model calibration.
Question 8. Based on your parameter modification of the Muskingum K and X parameters to match the results from HEC-RAS, how much confidence do you have in the Muskingum method in ungaged areas?
In ungaged areas, the Muskingum coefficients are somewhat uncertain. This is because both of the parameters K and X are difficult to estimate accurately using only physical characteristics of the channel. Also, the physical characteristics that are used are taken as averages for an entire reach. However, even excluding this effect, there are still other problems with the Muskingum method which are discussed in the next question.
Question 9. As you can imagine, the travel time estimated for the Muskingum method will be sensitive to channel characteristics such as roughness, slope, length, and cross section. If you consider routing a range of flows from small to large, how accurate do you think it is to use a single set of K and X coefficients for the Muskingum method?
The Muskingum linear storage routing coefficient, K, can cause problems for channel reaches that have cross sections with significant overbanks. K represents a linear relation between storage and outflow. A single flow value is normally assumed when estimating a flood wave velocity, which is then used in the estimation of K. In general, velocities in channels will vary with water depth. This is particularly so in a stream that has significant overbank areas. As the flow goes out of the channel and into a wide overbank, the depth-area relationship changes significantly. Because the Muskingum method reflects a linear storage-outflow relationship, it cannot accurately represent flows that range from in-channel to floodplain conditions. Generally, the larger the floodplain, the greater the difference between K for in-channel and K for flood flow conditions.
Additionally, the Muskingum X coefficient will also vary with different flows. One flood that remains within the banks of the channel may require a relatively high Muskingum X coefficient (for example 0.4). Meanwhile, a larger flood that goes out of bank may require a lower Muskingum X coefficient (0.015 for example).
Download the final project files here:
Note: The final project file is the same for the Lag, Muskingum, and Muskingum-Cunge routing method tutorials. If you are completing all three tutorials, the files only need to be downloaded once.
Continue to Applying the Muskingum-Cunge Routing Method
