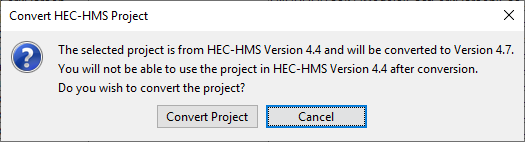
If you are prompted to convert the project to a later version, select "Convert Project" as in the figure below:
Background
The goal of this tutorial is to become familiar with entering cross section information in the paired data editor. The Muskingum-Cunge routing method has an option to define the cross section shape using an eight-point cross section. An eight-point cross section is defined using station and elevation information. If a detailed cross section is available, the cross section data points must be distilled to eight points that represent the cross section shape.
Overview
In this workshop you will identify the eight points that define the cross section shape and use the paired data editor to create a new cross section curve. The cross section can be used in one or many basin models in the HEC-HMS project. Once the cross section paired data curve is defined, you will select the curve within the Muskingum-Cunge routing Component Editor.
Review the field data shown in Figure 1. A detailed cross section was gathered from a field survey. The detailed cross section contains more than eight points. Figure 1 also shows eight points were extracted from the detailed cross section information. The eight points preserve the cross section shape
Open HEC-HMS and select the File menu. Choose the Open… menu option and select the Routing Workshop project.
Open the Paired Data Manager from the Components menu. Select the Cross Sections paired data type and click the New… button. Enter a Name of “upper” for the paired data curve and click the Create button.
Navigate to the new paired data curve in the Watershed Explorer. The paired data curve is located in the Cross Sections folder within the Paired Data folder. Click on the upper curve to open the Component Editor.
Within the Component Editor, set the Data Source to Manual Entry and the units to FT:FT.
Enter the eight station-elevation pairs from Figure 1 into the table provided on the Table tab. Figure 2 shows the Table and Graph tabs for the new cross section paired data curve.
Open the basin model named Musk-Cunge, shown in Figure 3. There are three reaches in the basin model, named Upper, Middle, and Lower. The reaches are connected to one another with water flowing from the Inflow Hydrograph source element to reach Upper, reach Middle, reach Lower, and then the Punxsutawney Local sink element. All Muskingum-Cunge parameters, except for the 8-point cross sections have already been defined for the three reaches.
Click on the Upper reach element to open the Component Editor. Select the Routing tab to see the Muskingum-Cunge parameters defined for the reach. The cross section shape has been set to Eight Point. As shown in Figure 4, click the Cross Section drop down list and select the “upper” paired data curve that was created above.