Software Version
HEC-HMS version 4.12 was used to create this tutorial.
This tutorial should take approximately 30 minutes to complete.
Introduction
NOAA Atlas 14 defines point precipitation-frequency estimates for select locations in the United States and it's territories. As part of the supplementary information for each volume, regional temporal patterns of precipitation are defined for 6-hour, 12-hour, 24-hour, and 96-hour storm durations. This tutorial illustrates how to apply NOAA Atlas 14 temporal patterns in the HEC-HMS hypothetical storm precipitation method.
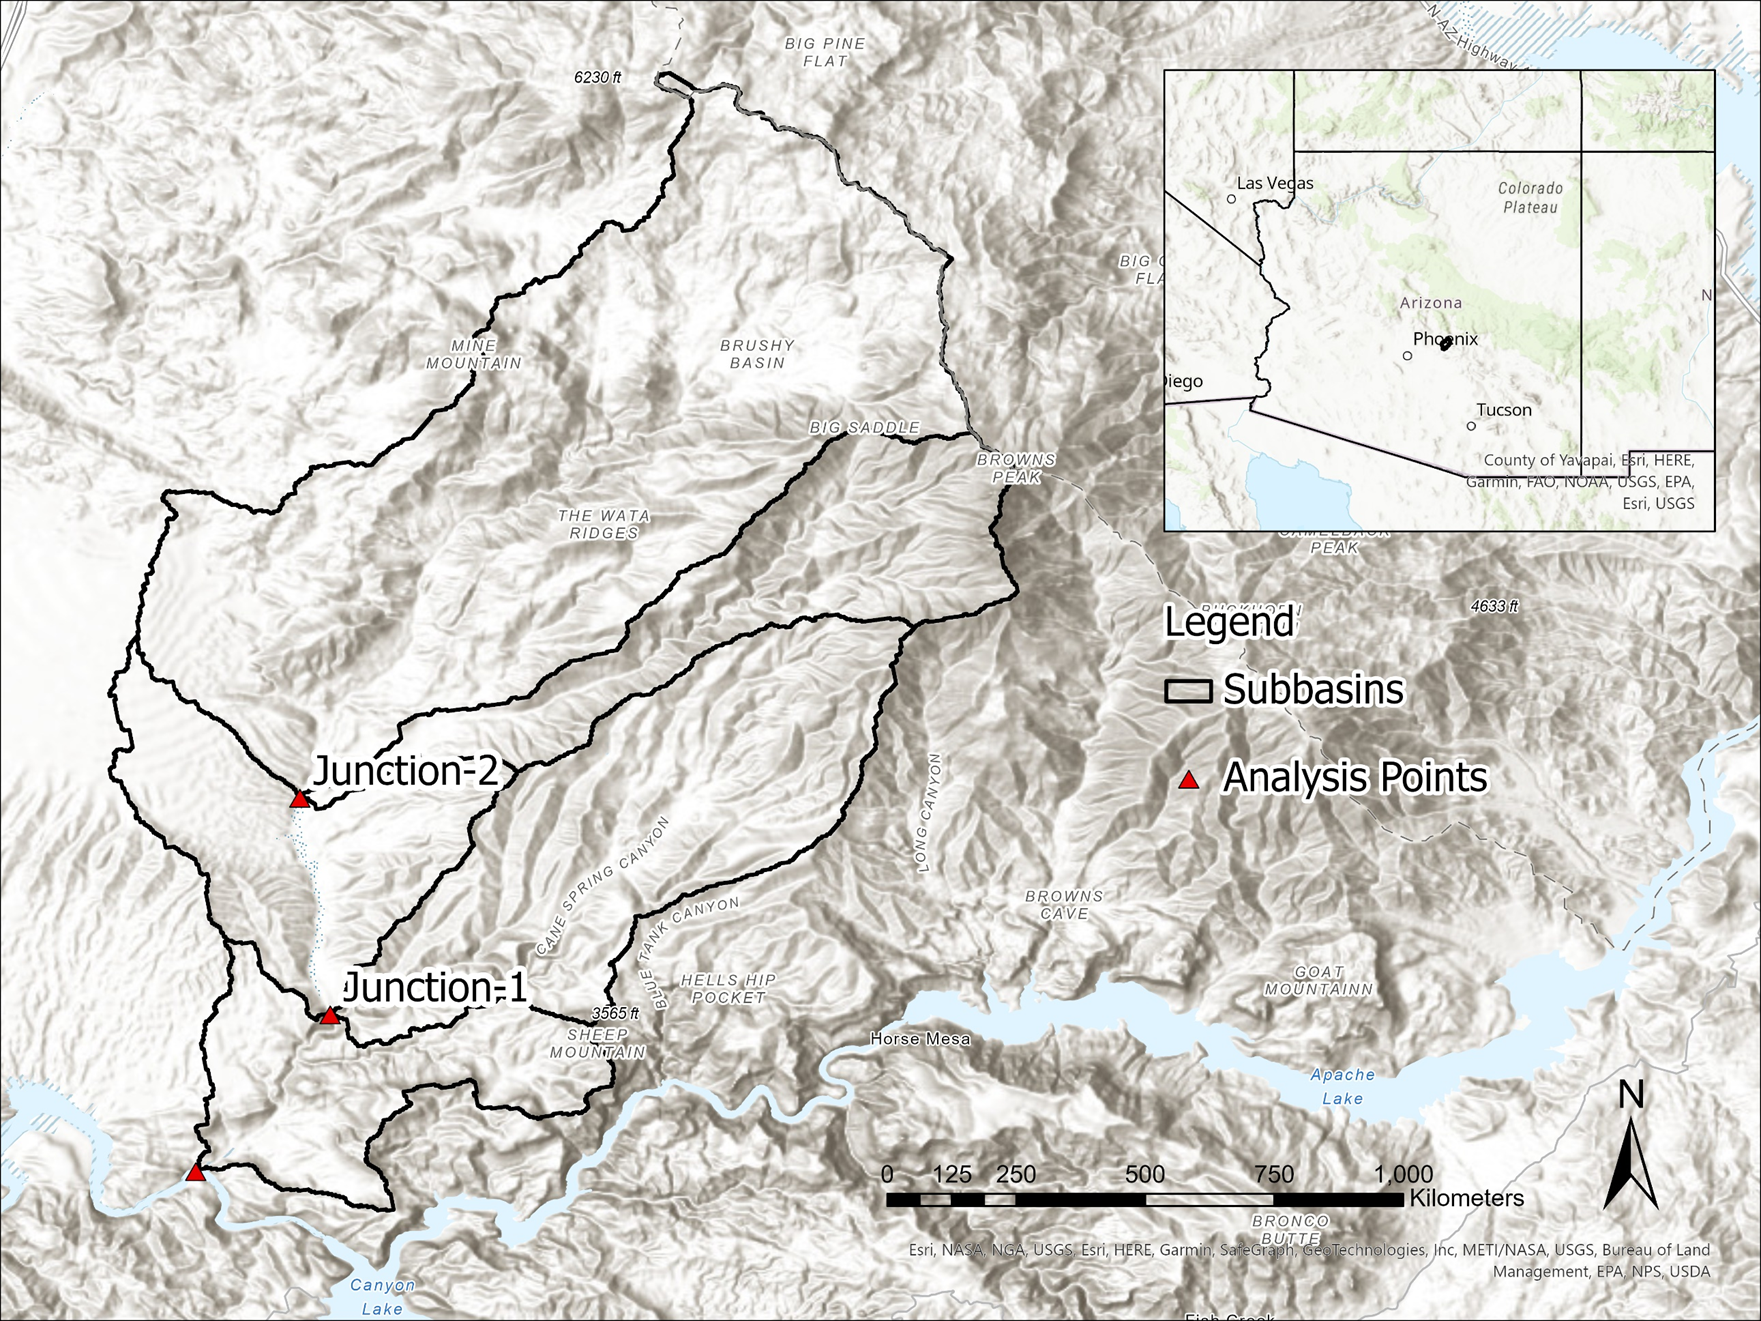
Study Area
Cottonwood Creek is a 64 square mile drainage the flows into the Salt River east of the Phoenix, AZ metropolitan area. This area falls within NOAA Atlas 14, Volume 1: Semiarid Southwest (Arizona, Southeast California, Nevada, New Mexico, Utah).
Data Download
NOAA Atlas 14 temporal patterns can be downloaded from the NOAA Precipitation Frequency Data Server.
In the Precipitation Frequency Data Server select a location in Arizona so that the data server is set to the correct volume.
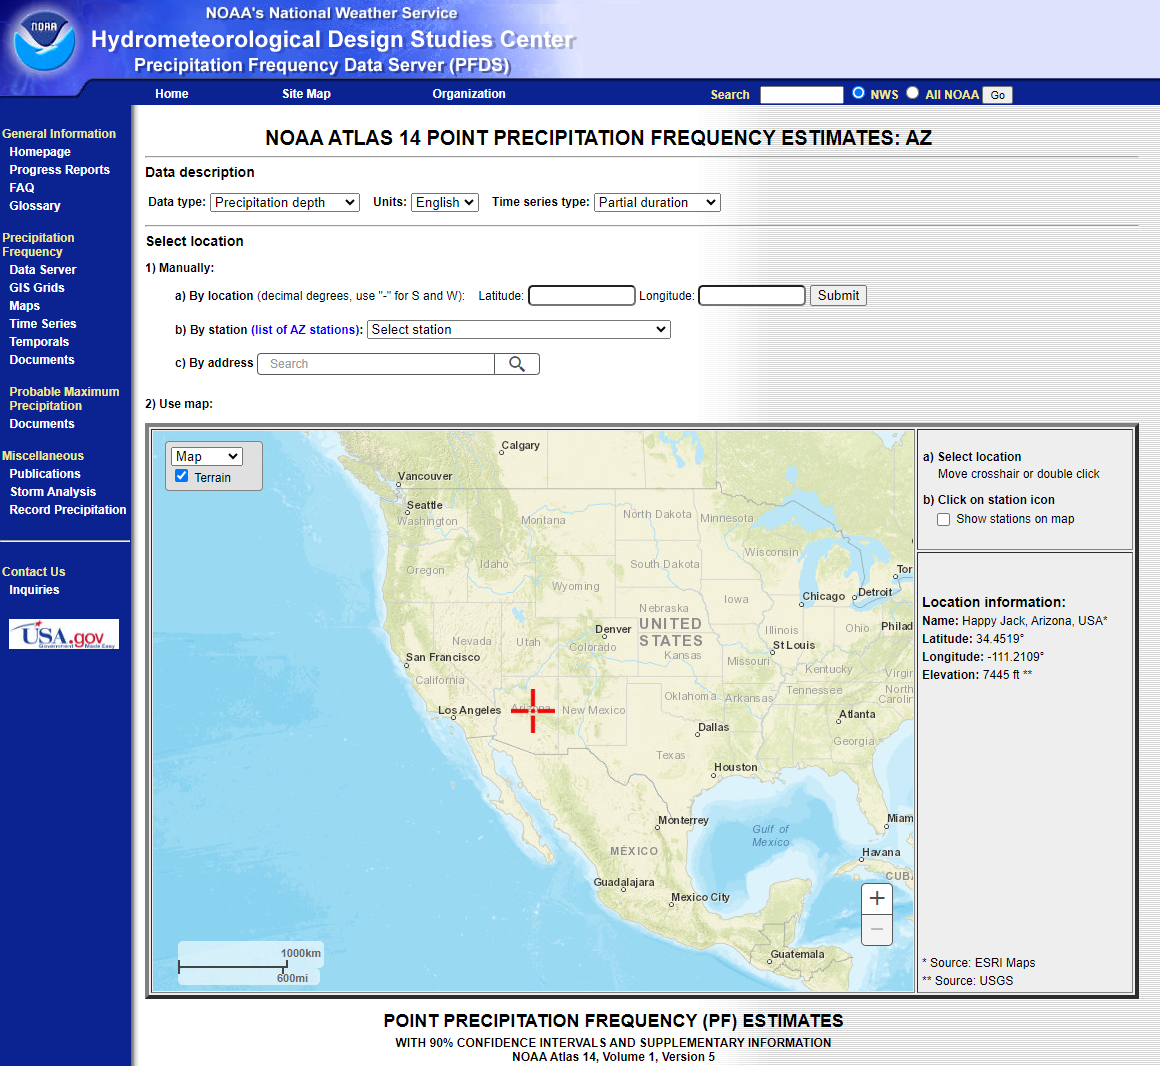
Select the supplementary information tab and then in the temporal distributions section select the 24-hour duration.
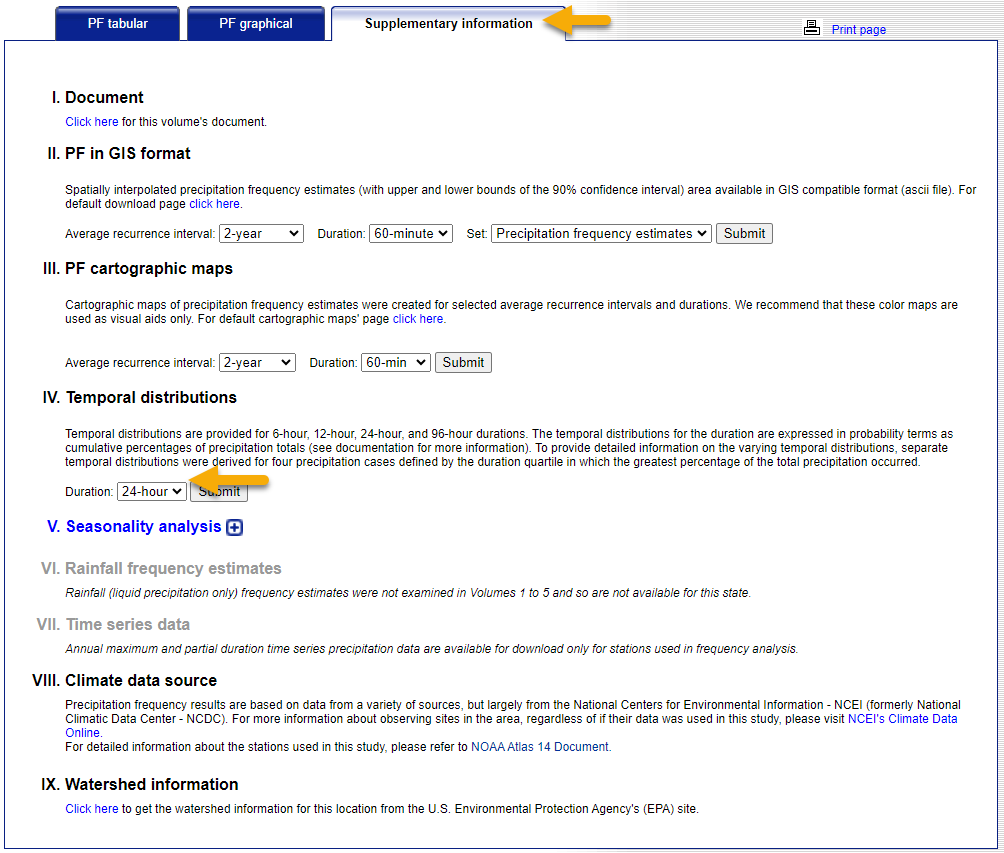
Click submit to download the 24-hour temporal patterns CSV file.
Import Temporal Patterns
In HEC-HMS, open the Cottonwood_Creek project.
Select Tools | Data | Atlas 14 | Temporal Pattern Importer to launch the import wizard.
On the first step of the wizard, specify the path to the temporal distribution CSV file.
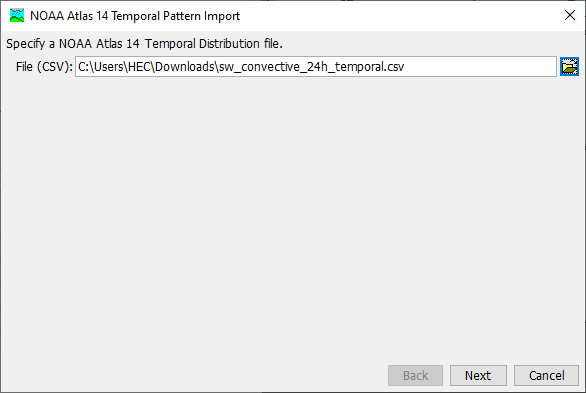
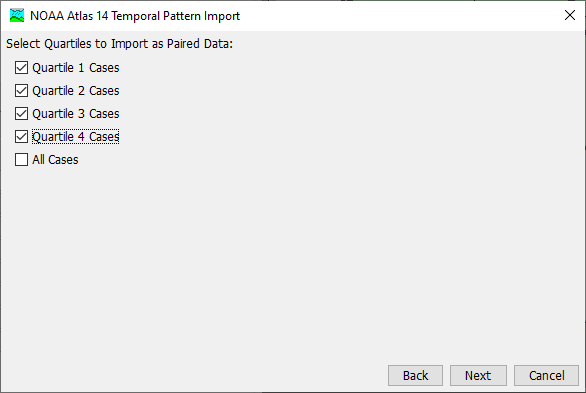
On the second step of the wizard, select Quartiles 1, 2, 3, and 4 for import.
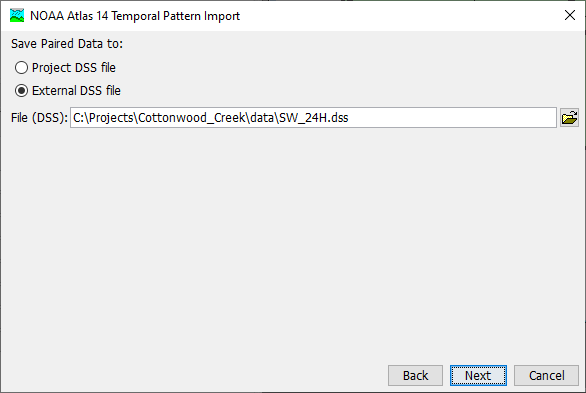
On the third step of the wizard, save the paired data to the default external HEC-DSS file.
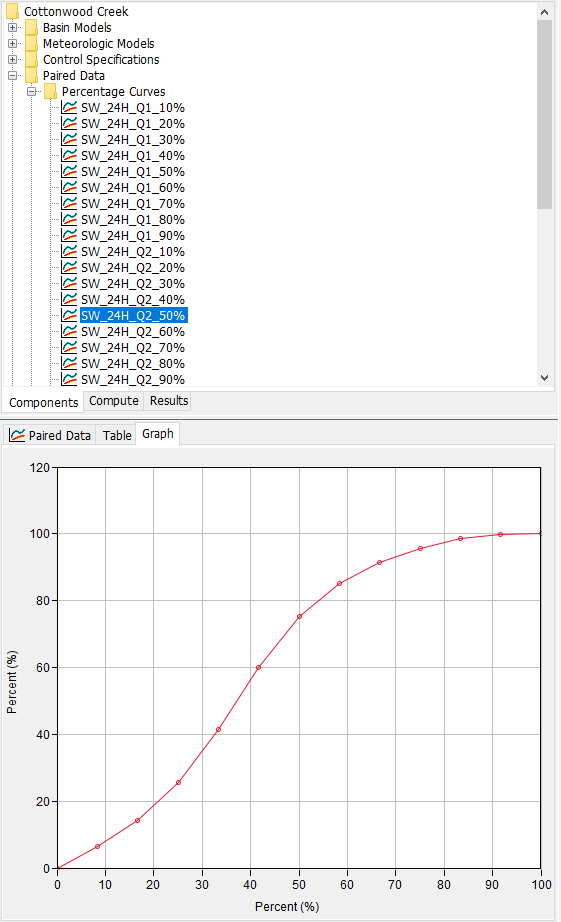
The imported temporal patterns can be viewed in the Watershed Explorer under the Paired Data, Percentage Curves node.
Run a Simulation
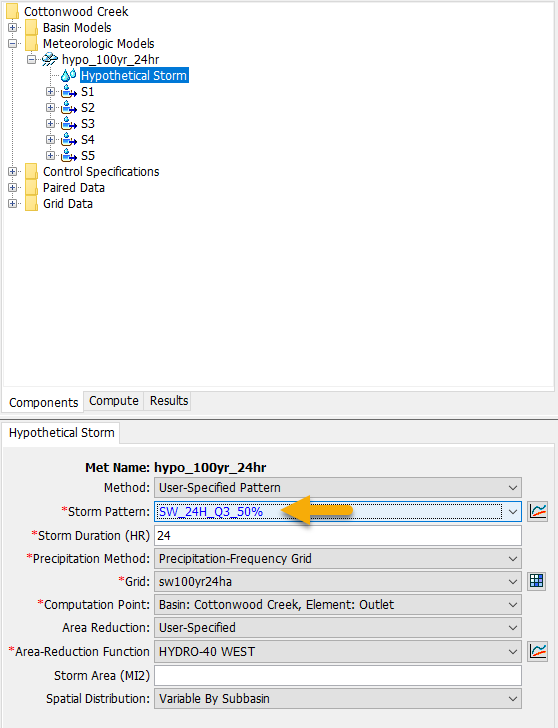
In the hypo_100yr_24hr meteorologic model, specify a storm pattern for the hypothetical storm. All of the imported storm patterns are valid. This example uses SW_24H_Q3_50% which represents a pattern where the greatest amount of precipitation fell in the third quartile and a 50% cumulative probability of occurrence among third quartile storms.
Compute the hypo_100yr_24hr simulation run.
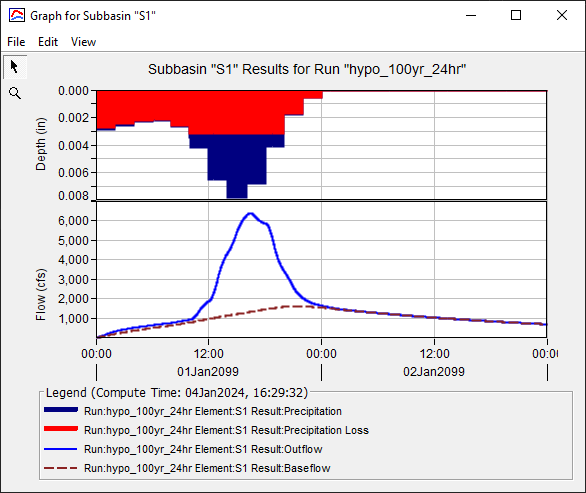
View the Element Summary Graph for any Subbasin to see the precipitation pattern applied over the subbasin.
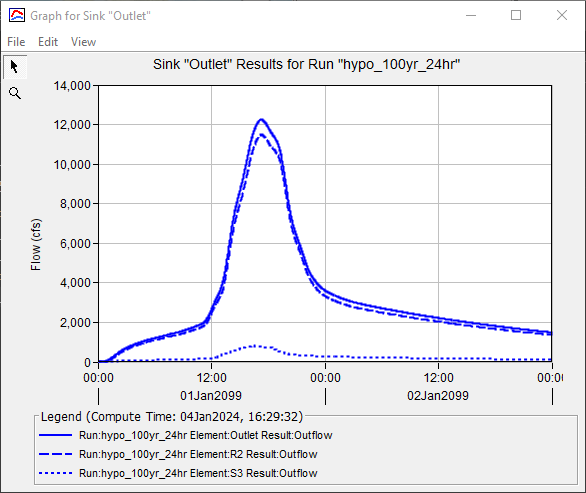
View the Element Summary Graph for the outlet to see the computed hydrograph at the outlet.
Summary
In this tutorial NOAA Atlas 14 temporal patterns were downloaded, imported to HEC-HMS, and applied in the HEC-HMS hypothetical storm.
For applying temporal patterns in a stochastic way, proceed to Sampling NOAA Atlas 14 Temporal Patterns.
