Download PDF
Download page Validating Precipitation Grid Sampling for Hypothetical and Frequency Storm.
Validating Precipitation Grid Sampling for Hypothetical and Frequency Storm
Download initial files here:Precipitation_Validation_Initial.zip
Download final files here: Precipitation_Validation_Final.zip
Introduction
HEC-HMS uses the same zonal statistics algorithm throughout the program to sample average raster values for polygons. Applications include the Expression Calculator, the Hypothetical Storm, and the Frequency Storm. In this tutorial we will use GIS tools to perform zonal statistics calculations for a grid, then we will use the Frequency Storm Calculator and Hypothetical Storm with a Precipitation Frequency grid to do the same calculations. We will compare the results from the different methods. This exercise was completed using HEC-HMS 4.10 and requires the users to have access to this version or newer to complete the Frequency Depth Calculator portion of this tutorial.
Downloading Gridded Frequency Precipitation data
The National Oceanic and Atmospheric Administration (NOAA) publishes precipitation frequency estimates in GIS compatible formats for the United States and some surrounding territories. GIS grid data can be downloaded from their website's Precipitation Frequency Data Server. Data is available to download as zipped ASCII files. You'll need to choose the appropriate grid based on the location of your watershed. You will also need to select the recurrence interval or frequency and the appropriate duration for your watershed. For this exercise, we are modeling Cottonwood Creek, a tributary of the Salt River located Northeast of Phoenix, AZ. We will be looking at the 100-year recurrence interval with a six-hour duration. The partial-duration series precipitation-frequency grids were downloaded for this example (you would choose the annual maximum series precipitation-frequency data when comparing HEC-HMS model results to a flow-frequency curve computed using Bulletin 17C procedures). This step has been completed for you and the 6-hour 100-YR precipitation frequency grid is provided in the downloaded materials.
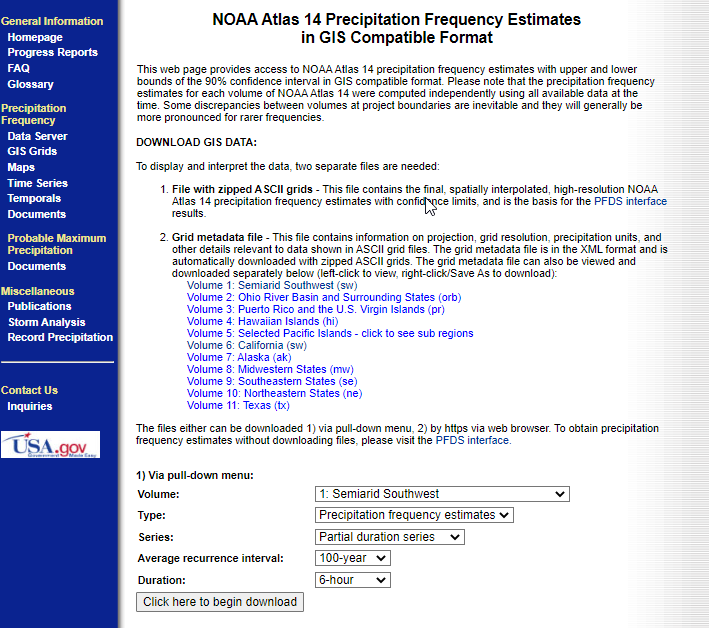
NOAA Atlas 14 Precipitation Frequency grid depths are in units of thousands of inches. A Unit Scale Factor correction must be applied when importing NOAA Atlas 14 grids into your model.
Extracting the average raster value for a subbasin polygon in ArcMap
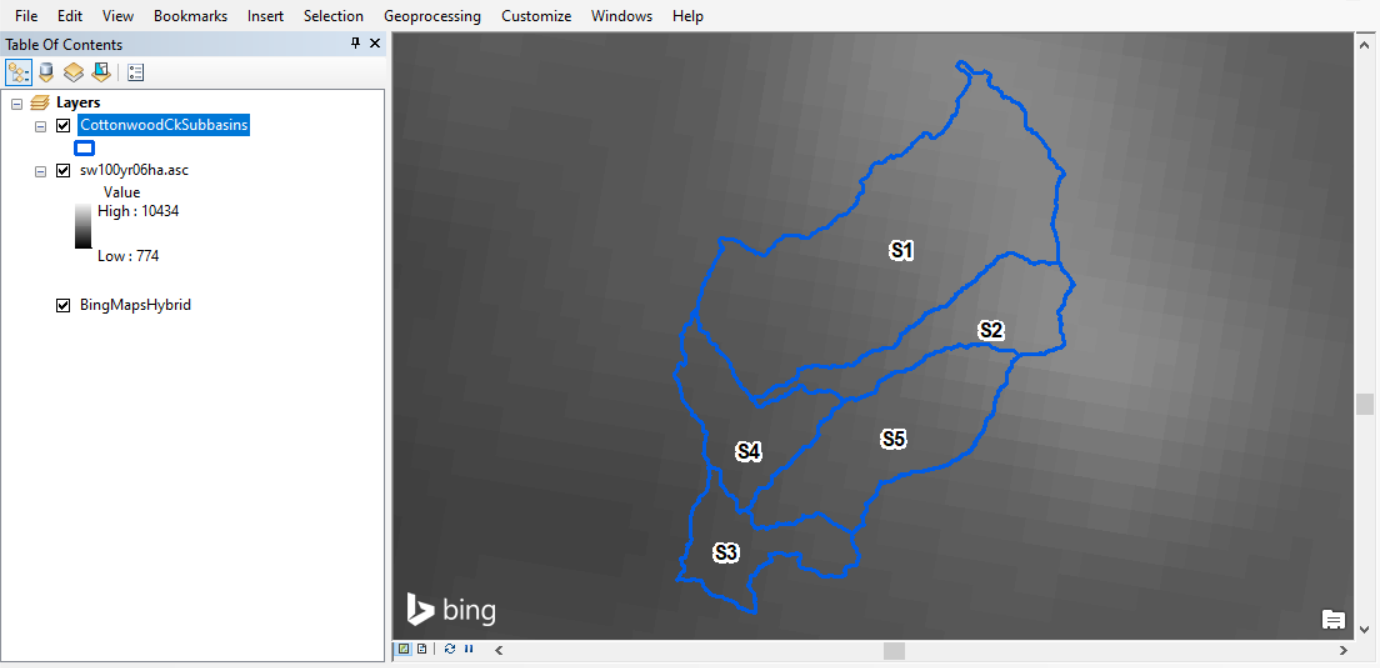
ESRI ArcGIS is a geographic information system that has a variety of tools to perform spatial statistics on raster data. For this step we will be using subbasin shapefiles to determine the spatially averaged 100-YR precipitation depth for the 6-hour storm within each subbasin with ArcMap geoprocessing tools.
- Open ArcMap and use the Catalog window to navigate to your downloaded materials.
Click and drag the sw100yr06ha.asc and CottonwoodCkSubbasins datasets, one at a time into the data view window. You can also add data by clicking the Add Data button from the toolbar ribbon and navigate to your downloaded materials.
Add Data button:

Click on the ArcToolbox button on the toolbar ribbon. Navigate to Spatial Analyst | Zonal. Double click on Zonal Statistics As Table to open the tool. The tool will open in its own dialog window.
ArcToolbox button:

- Select CottonwoodCkSubbasins from the Input raster or feature zone data dropdown. Select "Name" from the Zone field dropdown. Select sw100yr06ha.asc from the Input value raster dropdown.
- For Output table, browse to your folder directory and name the output table ZonalStatsGIS.
- Select MEAN for Statistics type.
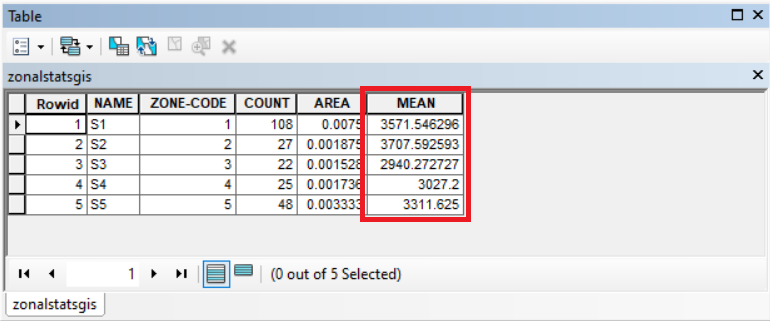
- Click OK. Once computed, the results table will be added to Table of Contents window. Right-click on the table and select Open Attribute Table to view results. Remember, results will display in units of thousands of inches.
- Select File | Save as and save your save the map as CottonwoodCk_100YRDepth.mxd.
Extracting the average raster value for a subbasin polygon in QGIS
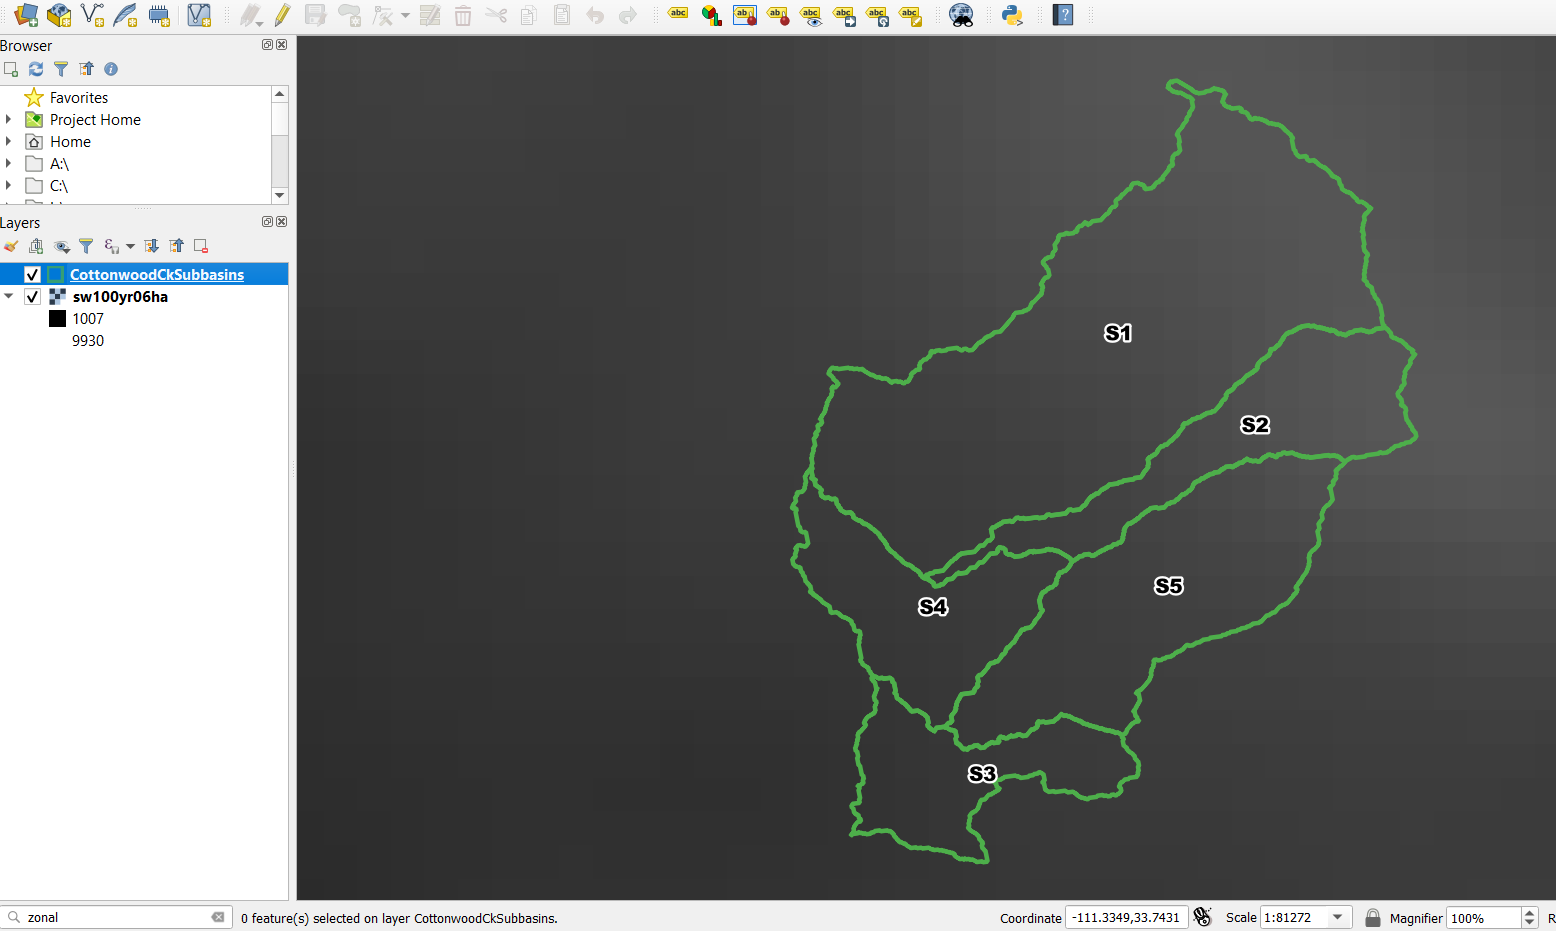
QGIS is a free and open-source geographic information system that offers much of same functionality as ArcMap. For this step we will be using subbasin shapefiles to determine the spatially averaged 100-YR precipitation depth for the 6-hour storm within each subbasin with QGIS geoprocessing tools.
Open QGIS and click the Open Data Source Manager button.
Open Data Source Manager button:

Select Vector to add the vector data. Set Source Type to File and Encoding to System. Browse to the downloaded materials and select the CottonCkSubbasins.shp file. The .shp extension must be selected in order to add the shapefile to the QGIS project.
- Click Add. You will see the subbasins shapefile has now been added to the Layer List window. Do not close the Data Source Manager window yet.
- Select Raster to add the raster data. Set Source Type to File. Browse to the downloaded materials and select the sw100yr06ha.asc file.
- Click Add. You will see the sw100yr06ha has now been added to the Layer List window. Click Close to close the Data Source Manager window.
- Find the Locator search bar in the lower left of the QGIS window. Type Zonal into the search bar and double-click on Zonal Statistics. The tool will open in its own dialog window.
- Select sw100yr06ha from the Raster layer dropdown. Raster band will automatically be set to Band 1 as this precipitation depth grid has only one band.
- Select CottonCkSubbasins from the Vector layer containing zones dropdown.
- In the Output column prefix field, type 100YRDEPTH_. This defines the name of the field to be appended to the shapefile attribute table which will contain selected zonal statistics.
- In the Statistics to calculate field select Mean. Deselect any other selected statistics.
- Click Run. The status bar will display 100% once the process has finished. Click Close to close the Zonal Statisitics dialog window. Right-click on the CottonCkSubbasins and select Open Attribute Table to view results. Remember, results will display in units of thousands of inches.
- Select File | Save as and save your save the map as CottonwoodCk_100YRDepth.qgz.

Using the Frequency Depth Calculator to extract a depth value for a subbasin polygon
The Frequency Depth Calculator is a feature introduced in HEC-HMS version 4.10. It requires a model with georeferenced subbasins and imported precipitation frequency grids. You can find a more detailed walk-through of importing frequency precipitation grids in the Applying New Frequency Storm Enhancements tutorial. The 100-YR precipitation grids have already been imported into the model provided in the downloaded materials.
- Start HEC-HMS (version 4.10 or newer) and open the Cottonwood Creek project. We will increase the precision of calculated values in our HMS model to further validate results between methods.
- Select Tools | Program Settings | Compute. Increase Expression calculator precision to 5. Click OK to close the Program Settings window.
- Open the meteorologic model by expanding the meteorologic model folder in the Watershed Explorer and expand the A14_100yr - Frequency Depth meteorologic model.
- Click on Frequency Storm to open the Frequency Storm Component Editor.
- Storm Duration: 6 Hours
- Intensity Duration: 15 Minutes
- Intensity Position: 50 Percent
- Area Reduction: --None-- (We are comparing unreduced depths, so Area Reduction is not necessary for this exercise)
- Spatial Distribution: Variable By Subbasin
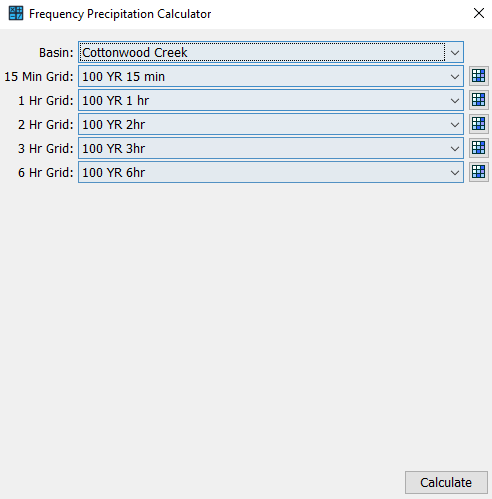
Click the Frequency Precipitation Calculator button. Set the Basin to Cottonwood Creek. Select the corresponding grid for 15 Min, 1 Hr, 2 Hr, 3 Hr and 6 Hr Grids.
Frequency Precipitation Calculator button:

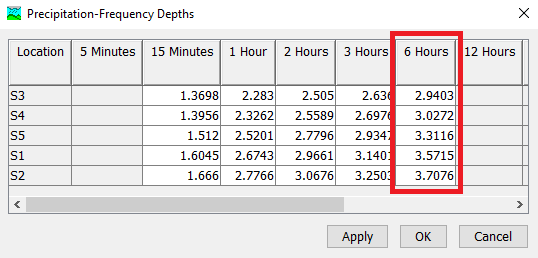
- Click Calculate to view results in the Precipitation-Frequency Depths dialog window.
- Click Apply and then Close to close the Precipitation-Frequency Depths dialog window.
Using the Hypothetical Storm to extract a depth value for a subbasin polygon
- Open the Cottonwood Creek HMS Model. We will increase the precision of depth result values in our HMS model to further validate results between methods.
- Select Tools | Program Settings | Results. Increase Depth digits to 4. Click OK to close the Program Settings window.
- Open the meteorologic model by expanding the meteorologic model folder in the Watershed Explorer and expand the A14_100yr - Hypothetical Storm meteorologic model.
- Click on Hypothetical Storm to open the Hypothetical Storm Component Editor.
- Method: User-Specified Pattern
- Storm Pattern: SW6hr_20%_1Q
- Storm Duration (HR): 6
- Precipitation Method: Precipitation-Frequency Grid
- Grid: 100 YR 6hr
- Computation Point: Outlet
- Area Reduction: --None--
Compute the 100YR Hypothetical Storm Depth-Area Analysis run by selecting the 100YR Hypothetical Storm run in the dropdown menu and clicking Depth Area Analysis Compute button. The depth area analysis is used in this example so we can simultaneously get precipitation depths averaged over each subbasin's drainage area within a single simulation.
Depth Area Analysis Compute button:

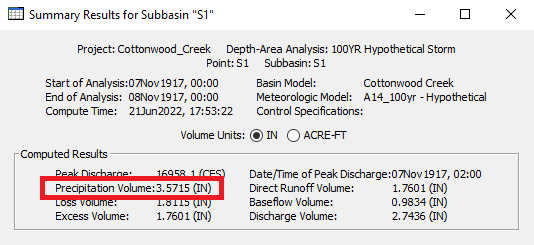
- Click on the Results tab of the Watershed Explorer. Expand the Depth-Area Analyses and navigate down to the S1 subbasin within the S1 folder. Click the Summary Table to view Precipitation Volume results. This is the 100-YR precipitation depth extracted from subbasin S1.
- Repeat step 6 for each of the remaining subbasins.
Comparing Results
Compare your results and confirm that all four methods yield the same results for the 6-hour 100-Year precipitation depth for each of the Cottonwood Creek subbasins.
| Subbasin | ArcMap | QGIS | HMS Frequency Depth Calculator | HMS Hypothetical Storm |
|---|---|---|---|---|
| S1 | 3.5715 | 3.5715 | 3.5715 | 3.5715 |
| S2 | 3.7076 | 3.7076 | 3.7076 | 3.7076 |
| S3 | 2.9403 | 2.9403 | 2.9403 | 2.9403 |
| S4 | 3.0272 | 3.0272 | 3.0272 | 3.0272 |
| S5 | 3.3116 | 3.3116 | 3.3116 | 3.3116 |
| Validation |