Download PDF
Download page Comparing GIS Processing Run Times with Different Size Terrain Models and Computers.
Comparing GIS Processing Run Times with Different Size Terrain Models and Computers
Introduction
"How large of a terrain model (file size) can HEC-HMS handle?" is a common question the HEC-HMS team receives now that the software can perform automated subbasin and reach delineation. The HEC-HMS team has successfully applied multi-gigabyte terrain files to the HEC-HMS GIS delineation tools with success. However, the amount of time required by the software to delineate watershed boundaries and stream reaches can be rather long when the terrain file size is large. Reducing the file size by resampling the terrain to a larger grid cell size (e.g. from 30 meters to 60 meters) will reduce the file size and processing time. One concern about resampling the terrain to a larger grid cell size is that a coarser grid will result in poor delineation results. This is a valid concern; however, the HEC-HMS terrain reconditioning tool can be used to add published watershed boundary and stream centerline information into the resampled terrain model. A tutorial showing how to the use HEC-HMS Terrain Reconditioning tool can be found here. The National Hydrography Dataset (NHD) contains watershed and stream centerline information that have been digitized at varying levels of detail. The HEC-HMS Terrain Reconditioning tool can be used to modify the terrain by "burning in" the stream centerlines and adding walls from the watershed polygons. Even though a detailed terrain model was resampled to a coarser grid cell size, reconditioning the terrain with streams and watershed boundaries will ensure the drainage area is accurately delineated and streams are correctly digitized.
The level of detail needed in a terrain model used for subbasin and reach delineation is different than the level of detail needed for hydraulic modeling. As this tutorial shows, accurate watershed boundaries can be delineated with coarser resolution terrain datasets. A 30, 60, or 90 meter terrain dataset is not detailed enough to capture channel geometry needed for a river hydraulics model, but these size terrain models could accurately capture watershed boundaries and stream networks. A detailed terrain model could be used to delineate reaches and subbasin boundaries; however, the processing time will be rather large.
This tutorial was designed to demonstrate processing times for the different HEC-HMS GIS tools. Three different computers were used for the tutorial. The table below shows the number of cores and amount of RAM available to each computer. Computer 01 represents a lower end laptop and computer 03 represents higher end laptops or desktop computers.
| Virtual Machine | Number of Cores | Amount of RAM (GB) |
|---|---|---|
01 | 4 | 8 |
| 02 | 6 | 16 |
| 03 | 8 | 32 |
The tutorial was also designed to demonstrate processing times for different terrain file sizes and that accuracy in subbasin and reach delineation can still be obtained when using a coarse terrain grid resolution if the HEC-HMS terrain reconditioning tool is used. The terrain models used for this tutorial are a portion of the Missouri River Watershed. The drainage area for the modeling domain is approximately 44,850 square miles. The 30 meter terrain dataset was gathered from the USGS National Map Viewer. The terrain files were mosaiced into one continuous terrain dataset, the dataset was projected, and the elevation values were converted to feet. A GIS was used to resample the 30 meter terrain dataset to two new datasets, one with a grid cell size of 60 meters and the other with a grid cell size of 90 meters. The following table shows the uncompressed size for the three terrain models.
| Terrain Resolution | Terrain File Size (MB) |
|---|---|
| 30 meters (90.48f ft) | 1,320 |
| 60 meters (196.85 ft) | 285 |
| 90 meters (295.276 ft) | 127 |
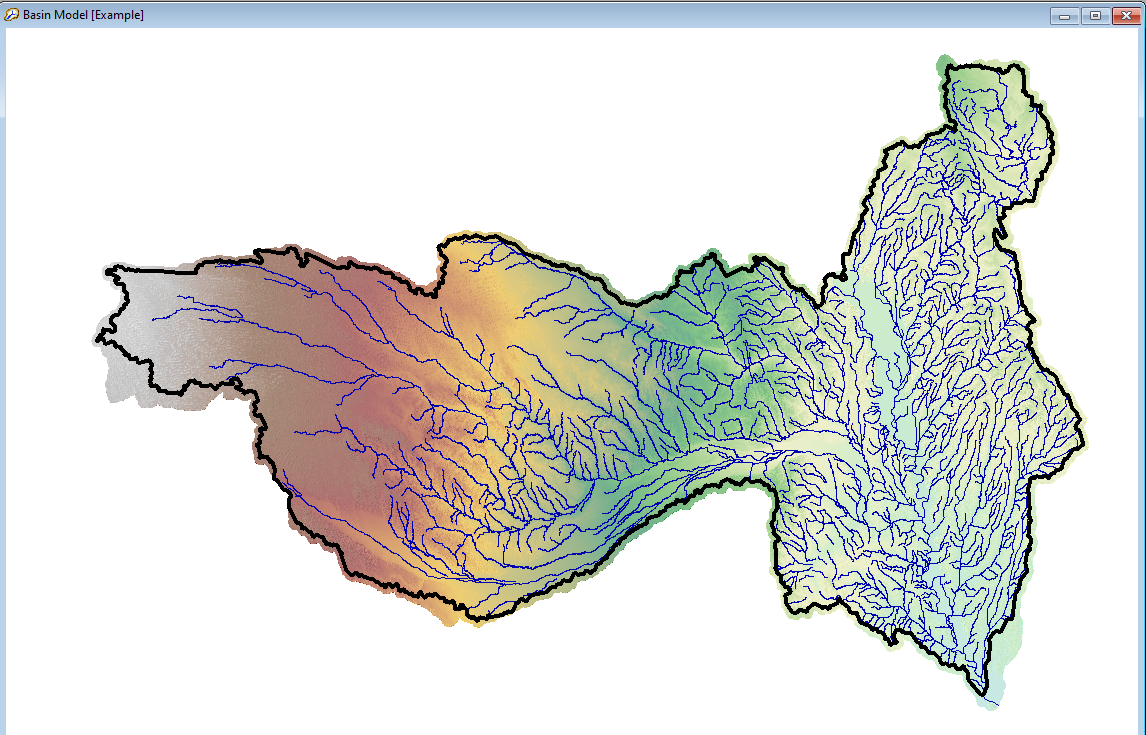
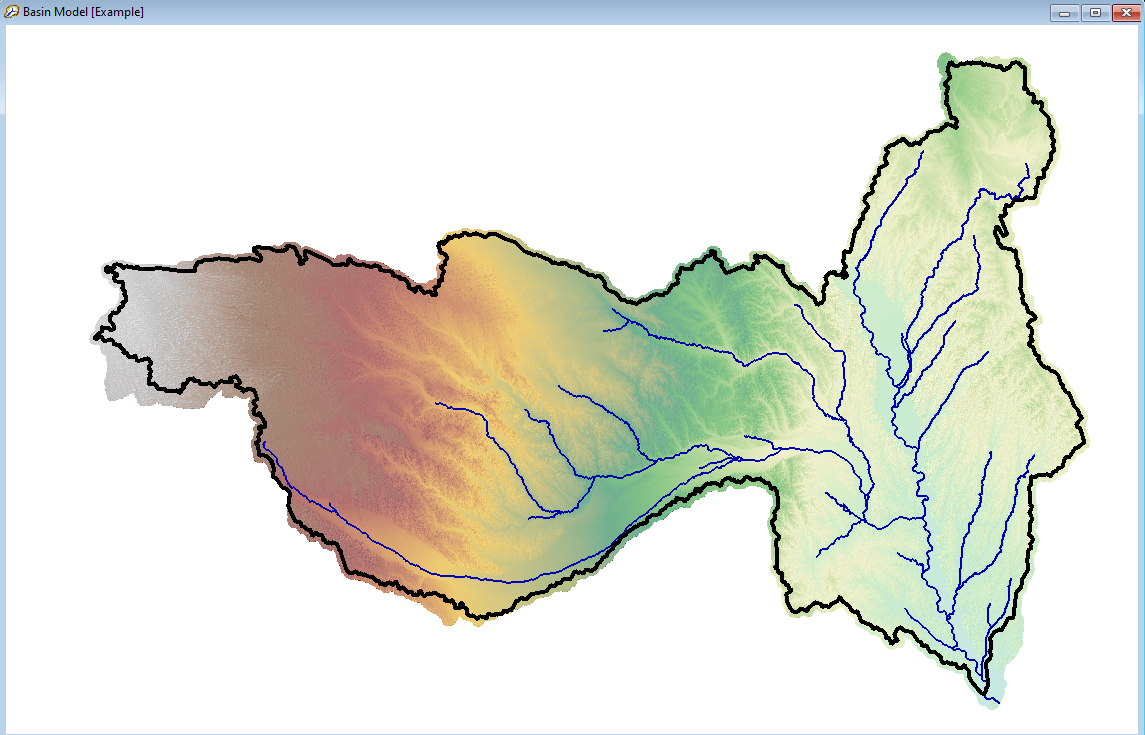
HEC-HMS version 4.9 beta 2 was used for this tutorial (improvements to HEC-HMS have already been made since this version and processing times for some of the tools shown below have been decreased). The three terrain datasets were added to an HEC-HMS project. Then a separate basin model was created, one for each of the terrain datasets. The HEC-HMS terrain reconditioning tool was used to force a total watershed boundary onto the terrain model. Flowlines (stream centerlines) from the NHD 1:100K dataset were burned into all three terrain models. The NHD flowline layer was edited by removing all streams that did not have a name defined in the attribute table. HUC boundaries or higher resolution stream lines could have been used to modify the terrain. The following figure shows the terrain, total watershed boundary, and 1:100K NHD flowlines.
Processing Run Times
Preprocess Sinks
The following table contains processing times (seconds) for the Preprocess Sinks tool. This tool will identify sinks in the terrain that prevent water from flowing across the surface and will create a new terrain model by filling in the sinks. Results indicate that the processing time can be decreased for larger datasets by using computers with more cores and RAM. However, there is not much difference in the processing time between computers for the 60 and 90 meter datasets (both datasets are smaller than 300 mb), which means the processing and RAM resources are not limiting for smaller terrain datasets. The difference in processing time between the terrain models is significant. The processing time is more than 5 times longer for the 30 meter terrain vs. the 60 meter terrain and 14 or more times longer for the 30 meter terrain vs. the 90 meter terrain. This processing time can add up if a number of iterations are required to improve the base terrain model. The longest amount of time needed to complete this GIS task (using Virtual Machine 01 and the 30 meter terrain) was less than 4 minutes.
| Virtual Machine | |||
|---|---|---|---|
| Terrain Resolution | 01 | 02 | 03 |
| 30 meters | 227 | 174 | 168 |
| 60 meters | 32 | 30 | 30 |
| 90 meters | 13 | 12 | 12 |
| Processing time is in seconds | |||
Terrain Preprocessing
The following table contains processing times (seconds) for the Terrain Preprocessing tool. The terrain preprocessing tool creates both the flow direction and flow accumulation datasets by determining the direction water flows from one grid cell to the next. Unlike results from the Preprocess Sinks analysis, results from the terrain preprocessing analysis indicate that the processing time can be decreased for all terrain datasets (regardless of the size) by using computers with more cores and RAM. Similar to results from the Preprocess Sinks analysis, differences in processing time between the terrain models is significant. The processing time is more than 10 times longer for the 30 meter terrain vs. the 60 meter terrain and more than 30 times longer for the 30 meter terrain vs. the 90 meter terrain. The longest amount of time needed to complete this GIS task (using Virtual Machine 01 and the 30 meter terrain) was approximately 21 minutes.
| Virtual Machine | |||
| Terrain Resolution | 01 | 02 | 03 |
|---|---|---|---|
| 30 meters | 1282 | 1098 | 934 |
| 60 meters | 122 | 107 | 88 |
| 90 meters | 41 | 35 | 29 |
| Processing time is in seconds | |||
Identify Streams
The following table contains processing times (seconds) for the Identify Streams tool. The identify streams tool identifies a reach once the drainage area exceeds the user defined threshold. Smaller area thresholds will result in the generation of more subbasin elements than larger area thresholds. In this example, the area threshold was set to 2000 square miles. Results indicate that more processing power and RAM do not improve the run times for the identify streams tools. However, the runtimes are drastically shorter for smaller sized terrain models. The longest amount of time needed to complete this GIS task (using Virtual Machine 01 and the 30 meter terrain) was approximately 1 minute.
| Virtual Machine | |||
| Terrain Resolution | 01 | 02 | 03 |
|---|---|---|---|
| 30 meters | 35 | 41 | 51 |
| 60 meters | 13 | 20 | 22 |
| 90 meters | 9 | 7 | 7 |
| Processing time is in seconds | |||
Delineate Elements
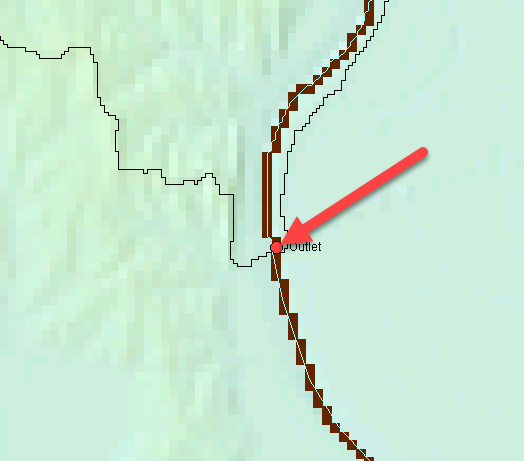
An outlet break point was added to each basin model. The location of the outlet was where the basin boundary shapefile intersected the identified stream layer as shown below.
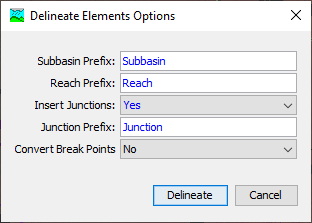
The delineate elements tool was used to create HEC-HMS subbasin, reach, and junction elements. The figure below shows the default prefixes used for element names.
The following table contains processing time (seconds) for the Delineate Elements tool. This is the time it took the program to create the georeferenced subbasin, reach, and junction elements. Results indicate that additional processors and RAM do reduce the amount of time it takes for the program to create the elements. This is especially true for the largest terrain dataset; however, there does not appear to be large improvements in performance between computers for the smaller terrain datasets.
| Virtual Machine | |||
| Terrain Resolution | 01 | 02 | 03 |
|---|---|---|---|
| 30 meters | 207 | 184 | 158 |
| 60 meters | 43 | 49 | 45 |
| 90 meters | 31 | 22 | 20 |
| Processing time is in seconds | |||
Splitting a Subbasin Element
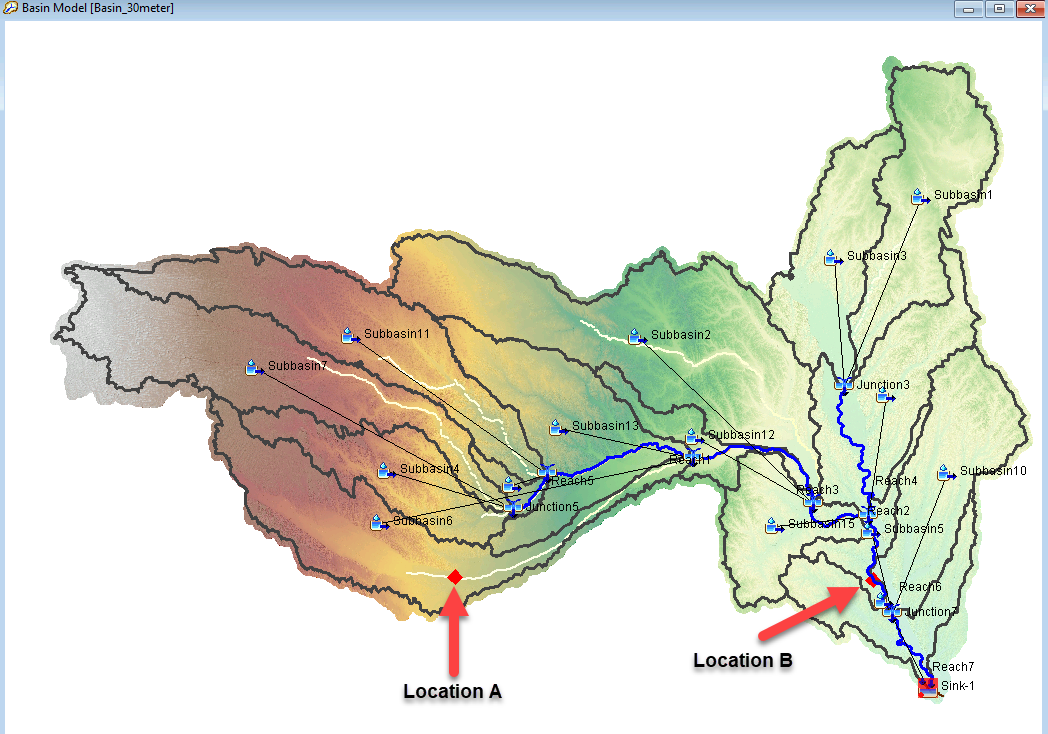
The split element tool was run once the subbasin, reach, and junction elements were created. Splitting a subbasin element can take a significant amount of time (merging elements is rather quick, even for large terrain datasets, and was not included in this tutorial). The figure below shows the two locations, location A and B, where subbasins were split into two subbasin elements. One subbasin is a headwater subbasin and the other is an interior subbasin.
The following table contains processing time (seconds) to split the model at location B, the interior subbasin. More processing and RAM resources do improve the amount of time it takes to split the subbasin element for the largest terrain dataset. Processing and RAM resources were not a factor for the smaller terrain datasets as run times were generally similar. Similar to other results, the smaller terrain datasets finish in a fraction of the time as the 30 meter terrain dataset.
| Virtual Machine | |||
| Terrain Resolution | 01 | 02 | 03 |
|---|---|---|---|
| 30 meters | 206 | 180 | 160 |
| 60 meters | 48 | 52 | 46 |
| 90 meters | 21 | 21 | 19 |
| Processing time is in seconds | |||
The following table contains processing time (seconds) to split the model at location A, the headwater subbasin. Trends in processing time were generally similar to the interior subbasin.
| Virtual Machine | |||
| Terrain Resolution | 01 | 02 | 03 |
|---|---|---|---|
| 30 meters | 127 | 121 | 117 |
| 60 meters | 38 | 38 | 37 |
| 90 meters | 16 | 16 | 15 |
| Processing time is in seconds | |||
Subbasin and Reach Characteristics
HEC-HMS includes tools to compute physical characteristics of the subbasin and reaches. The program uses the origin terrain dataset, not the reconditioned terrain dataset to compute the characteristics. Subbasin characteristics include the longest flowpath, flowpath slope, basin centroid, centroidal flowpath, and others. Reach characteristics include the reach length, slope, relief, and sinuosity.
The following table contains processing time (seconds) for the program to compute the subbasin characteristics. Results indicate very little improvement based on processing and RAM resources. The program is able to compute the subbasin characteristics about 10 times faster for the 90 meter terrain than the 30 meter terrain.
| Virtual Machine | |||
| Terrain Resolution | 01 | 02 | 03 |
|---|---|---|---|
| 30 meters | 219 | 124 | 114 |
| 60 meters | 27 | 24 | 18 |
| 90 meters | 12 | 12 | 12 |
| Processing time is in seconds | |||
The following table contains processing time (seconds) for the program to compute the reach characteristics. This tool does not require much processing and RAM recourses as processing time was rather short for all machines and datasets.
| Virtual Machine | |||
| Terrain Resolution | 01 | 02 | 03 |
|---|---|---|---|
| 30 meters | 4 | 4 | 4 |
| 60 meters | 1 | 1 | 1 |
| 90 meters | 1 | 1 | 1 |
| Processing time is in seconds | |||
Total Processing Time
The following table contains the total processing time (minutes) from the above steps. The number of cores and RAM resources did make a significant difference for the 30 meter terrain dataset (file uncompressed size for this terrain dataset was over 1 GB). The number of cores and RAM resources made a smaller impact for the 60 meter and 90 meter terrain datasets. The program was able to process the 60 meter dataset about 5 times faster than the 30 meter dataset and was able to process the 90 meter dataset about 10 times faster than the 30 meter dataset.
| Virtual Machines | |||
| Terrain Resolution | 01 | 02 | 03 |
|---|---|---|---|
| 30 meters | 38.5 | 32.5 | 28.4 |
| 60 meters | 5.0 | 5.5 | 4.8 |
| 90 meters | 2.4 | 2.0 | 1.9 |
| Processing time is in minutes | |||
Comparison of Delineated Elements
Drainage Area Comparison
Faster runtimes are not beneficial if the accuracy of the subbasin and reach delineation declines with coarser terrain models. The following table contains the subbasin drainage area for each of the three terrain models. Notice how the drainage area is very similar between the different terrain models. The resolution (grid cell size) did not negatively impact the delineation of subbasin elements. This was due to the fact that a somewhat detailed stream network was burned into all three terrain models. You can maintain accurate subbasin delineation when resampling a terrain model by burning in a stream network.
| Subbasin Name | Drainage Area (sq miles) 30 Meter Terrain | Drainage Area (sq miles) 60 Meter Terrain | Drainage Area (sq miles) 90 Meter Terrain | % Difference in Drainage Area between 30 Meter Terrain and 60 Meter Terrain | % Difference in Drainage Area between 30 Meter Terrain and 90 Meter Terrain |
| Subbasin7 | 5009.3 | 5030.1 | 5038.7 | -0.42% | -0.59% |
| Subbasin4 | 2336.8 | 2318.7 | 2325.9 | 0.77% | 0.47% |
| Subbasin11 | 4309.9 | 4308.5 | 4298.7 | 0.03% | 0.26% |
| Subbasin9 | 324.7 | 326.7 | 323.5 | -0.60% | 0.38% |
| Subbasin6 | 3264.4 | 3257.7 | 3256.9 | 0.21% | 0.23% |
| Subbasin13 | 2741.1 | 2734.1 | 2741.5 | 0.26% | -0.01% |
| Subbasin17 | 1683.3 | 1688.8 | 1676.8 | -0.33% | 0.39% |
| Subbasin2 | 7114.6 | 7118.5 | 7117.6 | -0.05% | -0.04% |
| Subbasin12 | 1160.1 | 1161.1 | 1165.1 | -0.09% | -0.43% |
| Subbasin1 | 3553.4 | 3556.0 | 3559.3 | -0.07% | -0.17% |
| Subbasin3 | 2722.8 | 2725.8 | 2722.6 | -0.11% | 0.01% |
| Subbasin8 | 3081.1 | 3076.6 | 3078.7 | 0.15% | 0.08% |
| Subbasin15 | 1965.8 | 1965.8 | 1965.0 | 0.00% | 0.04% |
| Subbasin16 | 706.5 | 708.73 | 712.4 | -0.31% | -0.84% |
| Subbasin10 | 3000.2 | 3001.7 | 2993.0 | -0.05% | 0.24% |
| Subbasin5 | 134.3 | 131.0 | 134.2 | 2.43% | 0.08% |
| Subbasin14 | 1754.7 | 1753.2 | 1753.0 | 0.09% | 0.10% |
In order to demonstrate how important it is to burn in a stream network (building walls can be important too, but was not explored in this tutorial), two additional sets of terrain models were developed. One model set had no stream network burned into the terrain, and the other model set had a very coarse stream network burned into the terrain models. The figure below shows the coarse stream network. Results indicate that burning in a stream network into the terrain model will preserve the drainage area as the terrain model is resampled to a larger cell size. As shown in the tables below, the differences in drainage area between the 30 meter and 60 meter and 30 meter and 90 meter terrain models are noticeably larger for the cases were no stream network was burned into the terrain. Also, results show that burning in a more detailed stream network is preferable than using a coarse stream network.
The following table shows subbasin areas for the case when no stream network was burned into the terrain. Notice the difference in drainage area between the 30 meter terrain and the 60 meter and 90 meter terrains is much larger than the results shown above where the detailed stream network was burned into the terrain datasets.
| Subbasin Name | Drainage Area (sq miles) 30 Meter Terrain | Drainage Area (sq miles) 60 Meter Terrain | Drainage Area (sq miles) 90 Meter Terrain | % Difference in Drainage Area between 30 Meter Terrain and 60 Meter Terrain | % Difference in Drainage Area between 30 Meter Terrain and 90 Meter Terrain |
| Subbasins7 | 5008.8 | 5017.2 | 5001.5 | -0.17% | 0.15% |
| Subbasins4 | 2336.8 | 2318.6 | 2325.0 | 0.78% | 0.50% |
| Subbasins11 | 4324.2 | 4298.3 | 4272.0 | 0.60% | 1.21% |
| Subbasins9 | 325.1 | 327.9 | 325.0 | -0.86% | 0.05% |
| Subbasins6 | 2885.3 | 3244.2 | 3240.9 | -12.44% | -12.32% |
| Subbasins13 | 2741.0 | 2735.3 | 2739.2 | 0.21% | 0.07% |
| Subbasins17 | 2062.1 | 1693.1 | 1685.9 | 17.89% | 18.24% |
| Subbasins2 | 7133.0 | 7134.0 | 7146.0 | -0.01% | -0.18% |
| Subbasins12 | 1183.0 | 1154.9 | 1157.6 | 2.38% | 2.15% |
| Subbasins1 | 9344.7 | 9356.3 | 9312.4 | -0.12% | 0.35% |
| Subbasins15 | 1939.7 | 1966.1 | 1965.8 | -1.36% | -1.35% |
| Subbasins16 | 683.0 | 633.8 | 679.9 | 7.20% | 0.45% |
| Subbasins10 | 2895.9 | 3053.5 | 3009.2 | -5.44% | -3.91% |
| Subbasins5 | 259.3 | 63.1 | 79.3 | 75.66% | 69.42% |
| Subbasins14 | 1751.0 | 1322.2 | 1305.5 | 24.49% | 25.44% |
The following table shows subbasin areas for the case where a coarse stream network was burned into the terrain. Notice the difference in drainage area between the 30 meter terrain and the 60 meter and 90 meter terrains is much larger than the results shown above where the detailed stream network was burned into the terrain datasets. Results indicate that burning in a coarse stream network does not provide significant improvement for subbasin and reach delineation.
| Subbasin Name | Drainage Area (sq miles) 30 Meter Terrain | Drainage Area (sq miles) 60 Meter Terrain | Drainage Area (sq miles) 90 Meter Terrain | % Difference in Drainage Area between 30 Meter Terrain and 60 Meter Terrain | % Difference in Drainage Area between 30 Meter Terrain and 90 Meter Terrain |
| Subbasin7 | 5009.3 | 5030.0 | 5038.7 | -0.41% | -0.59% |
| Subbasin4 | 2336.9 | 2318.7 | 2325.8 | 0.78% | 0.47% |
| Subbasin11 | 4310.0 | 4308.6 | 4298.6 | 0.03% | 0.26% |
| Subbasin9 | 324.7 | 326.5 | 323.5 | -0.57% | 0.36% |
| Subbasin6 | 2888.7 | 2607.0 | 3257.0 | 9.75% | -12.75% |
| Subbasin13 | 3578.0 | 3482.3 | 3539.2 | 2.67% | 1.08% |
| Subbasin17 | 1439.2 | 1802.5 | 1054.6 | -25.24% | 26.72% |
| Subbasin2 | 7114.6 | 7119.1 | 7114.8 | -0.06% | 0.00% |
| Subbasin12 | 968.9 | 949.6 | 992.5 | 1.99% | -2.44% |
| Subbasin1 | 3562.5 | 3551.6 | 3572.7 | 0.31% | -0.29% |
| Subbasin3 | 2703.9 | 2723.9 | 2702.9 | -0.74% | 0.04% |
| Subbasin8 | 3088.0 | 3079.7 | 3081.5 | 0.27% | 0.21% |
| Subbasin15 | 1939.7 | 1965.6 | 1964.8 | -1.34% | -1.29% |
| Subbasin16 | 683.0 | 633.3 | 688.6 | 7.28% | -0.82% |
| Subbasin10 | 3065.8 | 3117.1 | 3069.3 | -1.67% | -0.11% |
| Subbasin5 | 90.0 | 65.8 | 78.9 | 26.90% | 12.34% |
| Subbasin14 | 1749.2 | 1770.8 | 1748.4 | -1.23% | 0.05% |
Comparison of Subbasin and Reach Characteristics
One final comparison was made between some of the common subbasin and reach characteristics modelers use when estimating model parameters. The subbasin characteristics chosen were the longest flowpath length and the longest flowpath slope. The reach characteristics chosen were the reach length and slope. These characteristics were computed within HEC-HMS.
Longest Flowpath Length
The following table contains the longest flowpath length computed for each subbasin and terrain dataset. The average difference in computed longest flowpath length between the 30 meter and 60 meter terrain datasets is 4.2 percent. The average difference in computed longest flowpath length between the 30 meter and 90 meter terrain datasets is 6.8 percent. The longest flowpath lengths would be more similar between the different terrain models if a more detailed stream network would have been burned into the terrain models. The 1:24K scale NHD flowline information is much more detailed than the 1:100K scale NHD flowline layer that was used for this tutorial, it contains steams that extent far into headwater areas.
| Subbasin Name | Longest Flowpath Length (miles) 30 Meter Terrain | Longest Flowpath Length (miles) 60 Meter Terrain | Longest Flowpath Length (miles) 90 Meter Terrain | % Difference in Longest Flowpath Length between 30 Meter Terrain and 60 Meter Terrain | % Difference in Longest Flowpath Length between 30 Meter Terrain and 90 Meter Terrain |
| Subbasin7 | 286.202 | 293.551 | 285.158 | -2.57% | 0.36% |
| Subbasin4 | 218.751 | 209.683 | 197.343 | 4.15% | 9.79% |
| Subbasin11 | 276.902 | 271.246 | 267.811 | 2.04% | 3.28% |
| Subbasin9 | 76.722 | 65.923 | 62.316 | 14.08% | 18.78% |
| Subbasin6 | 217.951 | 213.950 | 211.338 | 1.84% | 3.03% |
| Subbasin13 | 200.621 | 183.081 | 173.735 | 8.74% | 13.40% |
| Subbasin17 | 260.861 | 238.942 | 217.117 | 8.40% | 16.77% |
| Subbasin2 | 347.702 | 337.112 | 329.912 | 3.05% | 5.12% |
| Subbasin12 | 166.657 | 150.196 | 144.325 | 9.88% | 13.40% |
| Subbasin1 | 286.921 | 270.562 | 256.922 | 5.70% | 10.46% |
| Subbasin3 | 172.484 | 166.482 | 161.213 | 3.48% | 6.53% |
| Subbasin8 | 162.927 | 157.888 | 155.983 | 3.09% | 4.26% |
| Subbasin15 | 113.964 | 108.358 | 106.314 | 4.92% | 6.71% |
| Subbasin16 | 91.700 | 90.977 | 90.302 | 0.79% | 1.52% |
| Subbasin10 | 144.832 | 144.018 | 143.341 | 0.56% | 1.03% |
| Subbasin5 | 40.821 | 41.047 | 41.923 | -0.55% | -2.70% |
| Subbasin14 | 105.344 | 101.448 | 100.560 | 3.70% | 4.54% |
Longest Flowpath Slope
The following table contains the longest flowpath slope computed for each subbasin and terrain dataset. The average difference in computed longest flowpath slope between the 30 meter and 60 meter terrain datasets is -4.1 percent. The average difference in computed longest flowpath length between the 30 meter and 90 meter terrain datasets is -6.9 percent. The longest flowpath slopes would be more similar between the different terrain models if a more detailed stream network would have been burned into the terrain models; however, there will be differences in slope between terrain models since larger resolution (larger grid cell size) have elevations averaged over a larger area than the smaller resolution terrain models.
| Subbasin Name | Longest Flowpath Slope (ft/ft) 30 Meter Terrain | Longest Flowpath Slope (ft/ft) 60 Meter Terrain | Longest Flowpath Slope (ft/ft) 90 Meter Terrain | % Difference in Longest Flowpath Slope between 30 Meter Terrain and 60 Meter Terrain | % Difference in Longest Flowpath Slope between 30 Meter Terrain and 90 Meter Terrain |
| Subbasin7 | 0.00148 | 0.00142 | 0.00150 | 4.05% | -1.35% |
| Subbasin4 | 0.00119 | 0.00126 | 0.00134 | -5.88% | -12.61% |
| Subbasin11 | 0.00156 | 0.00163 | 0.00160 | -4.49% | -2.56% |
| Subbasin9 | 0.00164 | 0.00190 | 0.00193 | -15.85% | -17.68% |
| Subbasin6 | 0.00141 | 0.00142 | 0.00147 | -0.71% | -4.26% |
| Subbasin13 | 0.00104 | 0.00111 | 0.00117 | -6.73% | -12.50% |
| Subbasin17 | 0.00108 | 0.00118 | 0.00124 | -9.26% | -14.81% |
| Subbasin2 | 0.00087 | 0.00089 | 0.00090 | -2.30% | -3.45% |
| Subbasin12 | 0.00117 | 0.00129 | 0.00134 | -10.26% | -14.53% |
| Subbasin1 | 0.00047 | 0.00050 | 0.00053 | -6.38% | -12.77% |
| Subbasin3 | 0.00062 | 0.00064 | 0.00067 | -3.23% | -8.06% |
| Subbasin8 | 0.00063 | 0.00065 | 0.00066 | -3.17% | -4.76% |
| Subbasin15 | 0.00123 | 0.00130 | 0.00132 | -5.69% | -7.32% |
| Subbasin16 | 0.00111 | 0.00112 | 0.00113 | -0.90% | -1.80% |
| Subbasin10 | 0.00086 | 0.00084 | 0.00084 | 2.33% | 2.33% |
| Subbasin5 | 0.00164 | 0.00159 | 0.00159 | 3.05% | 3.05% |
| Subbasin14 | 0.00110 | 0.00114 | 0.00115 | -3.64% | -4.55% |
Reach Length
The following table contains the reach lengths computed for each reach and terrain dataset. The average difference in computed reach length between the 30 meter and 60 meter terrain datasets is -0.16 percent. The average difference in computed reach length between the 30 meter and 90 meter terrain datasets is -0.03 percent. The reach lengths from the different terrain models are much closer to one another than the longest flowpath lengths. They are more similar because all reaches were included in the NHD flowline layer that was burned into the terrain models.
| Reach Name | Reach Length (miles) 30 Meter Terrain | Reach Length (miles) 60 Meter Terrain | Reach Length (miles) 90 Meter Terrain | % Difference in Reach Length between 30 Meter Terrain and 60 Meter Terrain | % Difference in Reach Length between 30 Meter Terrain and 90 Meter Terrain |
| Reach4 | 24.518 | 24.484 | 24.469 | 0.14% | 0.20% |
| Reach1 | 71.882 | 71.943 | 71.618 | -0.09% | 0.37% |
| Reach9 | 70.515 | 70.403 | 70.055 | 0.16% | 0.65% |
| Reach3 | 76.346 | 76.718 | 76.677 | -0.49% | -0.43% |
| Reach2 | 34.736 | 34.934 | 34.939 | -0.57% | -0.59% |
| Reach5 | 77.232 | 77.337 | 77.232 | -0.14% | 0.00% |
| Reach6 | 33.818 | 33.788 | 33.792 | 0.09% | 0.08% |
| Reach8 | 21.223 | 21.263 | 21.217 | -0.19% | 0.03% |
| Reach7 | 45.636 | 45.818 | 45.912 | -0.40% | -0.60% |
Reach Slope
The following table contains the reach slopes computed for each reach and terrain dataset. The average difference in computed reach slope between the 30 meter and 60 meter terrain datasets is 0.51 percent. The average difference in computed reach slope between the 30 meter and 90 meter terrain datasets is -0.23 percent. Even though the reach slopes from the different terrain models are much closer to one another than the longest flowpath slopes, they are not exactly the same because elevations from the 60 meter and 90 meter terrain models are slightly different than the 30 meter terrain model.
Reach Name | Reach Slope (ft/ft) 30 Meter Terrain | Reach Slope (ft/ft) 60 Meter Terrain | Reach Slope (ft/ft) 90 Meter Terrain | % Difference in Reach Slope between 30 Meter Terrain and 60 Meter Terrain | % Difference in Reach Length Slope between 30 Meter Terrain and 90 Meter Terrain |
Reach4 | 0.00101 | 0.00100 | 0.00100 | 0.99% | 0.99% |
Reach1 | 0.00086 | 0.00086 | 0.00087 | 0.00% | -1.16% |
Reach9 | 0.00111 | 0.00112 | 0.00112 | -0.90% | -0.90% |
Reach3 | 0.00086 | 0.00086 | 0.00086 | 0.00% | 0.00% |
Reach2 | 0.00068 | 0.00068 | 0.00068 | 0.00% | 0.00% |
Reach5 | 0.00016 | 0.00016 | 0.00016 | 0.00% | 0.00% |
Reach6 | 0.00018 | 0.00018 | 0.00019 | 0.00% | -5.56% |
Reach8 | 0.00016 | 0.00016 | 0.00016 | 0.00% | 0.00% |
Reach7 | 0.00022 | 0.00021 | 0.00021 | 4.55% | 4.55% |
Summary
The main findings from testing different computers and terrain file sizes are:
- The HEC-HMS GIS tools can work with large terrain files. The largest terrain file used for this tutorial was 1.32 GB.
- The terrain file size will impact the amount of time needed to complete the GIS delineation tools in HEC-HMS. Using a standard USACE laptop computer (6 cores and 16 GB RAM), the total time to complete the GIS steps and delineate a watershed was 32.5 minutes for a 1,320 MB terrain, 5.5, minutes for a 285 MB terrain, and 2.0 minutes for a 127 MB terrain.
- The number of cores and amount of RAM can reduce the amount of processing time needed by the HEC-HMS GIS delineation tools, especially for larger terrain datasets. It took 28.4 minutes on the 8 core, 32 GB RAM computer, 32.5 minutes on the 6 core, 16 GB RAM computer, and 38.5 minutes on the 4 core, 8 GB RAM computer to complete the GIS delineation steps.
- Burning in a detailed stream network can improve delineation results. The study found that 60 meter and 90 meter terrain models were able to reproduce delineation results from a 30 meter terrain model after a detailed stream network was burned into the terrain models.
If interested, the example project used for this tutorial can be downloaded from HERE. The file size is 4.1 GB, it will take a while to download. HEC-HMS 4.9, or a more recent version, will be needed to open the project.