Last Modified: 2024-06-27 14:09:40.222
This guide is designed to be the final workshop in the Advanced Applications of HEC-HMS class. The goal is to develop a hydrologic model and calibrate the model to observed streamflow using gridded precipitation and gridded temperature. Lectures and workshops from the Basic and Advanced HEC-HMS classes touch on components needed to create a hydrologic model, this guide ties everything together and gives you an opportunity to complete all the basic steps for a single application.
Long term continuous simulation can be used to build a dataset to develop and supplement flow-frequency information from short window of observations. The observed data for the example watershed only contains 50 years of observations. With the widespread availability of precipitation and temperature datasets that go back to the early 1900's, continuous modeling is one method to add additional information when computing flow-frequency curves. Another option is to simulate discrete hypothetical floods and assuming the probability for the precipitation (typically gathered from NOAA Atlas 14) is equal to the probability of the simulated flow. This approach often has many assumptions involved; whereas, results from a continuous hydrologic simulation model can be useful. In addition to developing a calibrated model, this final project is also designed to illustrate application of the continuous model.
Tasks
The following major tasks will serve as an outline for the workshop:
- Download, import, and manipulate gridded precipitation, temperature, and snow data
- Calibrate the model for Water Years (WY) 1983 - 1992
- Validate the model for WY 1993 - 2002
- Perform a period of record simulation for WY 1916 - 2018. Estimate flow-frequency for the extended period of record.
- Document Final Model Parameters and Results
This workshop should take you approximately four hours to complete if you are new to HEC-HMS and hydrologic modeling.
Study Area
The Tule River watershed upstream of Success Dam is used for this example. Success Dam (now commonly known as Schafer Dam) is located upstream of the town of Porterville, California. Success Dam is an approximately 160 foot tall earthen embankment with the authorized purposes of flood control and irrigation, as shown in the following figure. The watershed upstream of Success Dam encompasses approximately 390 square miles. Elevations within this watershed range from 650 feet at the dam to over 8,000 feet along the watershed boundary.

Review Existing HEC-HMS Project
Initial project files can be downloaded from Task 2
An HEC-HMS project named Schafer_Dam has already been created for you.
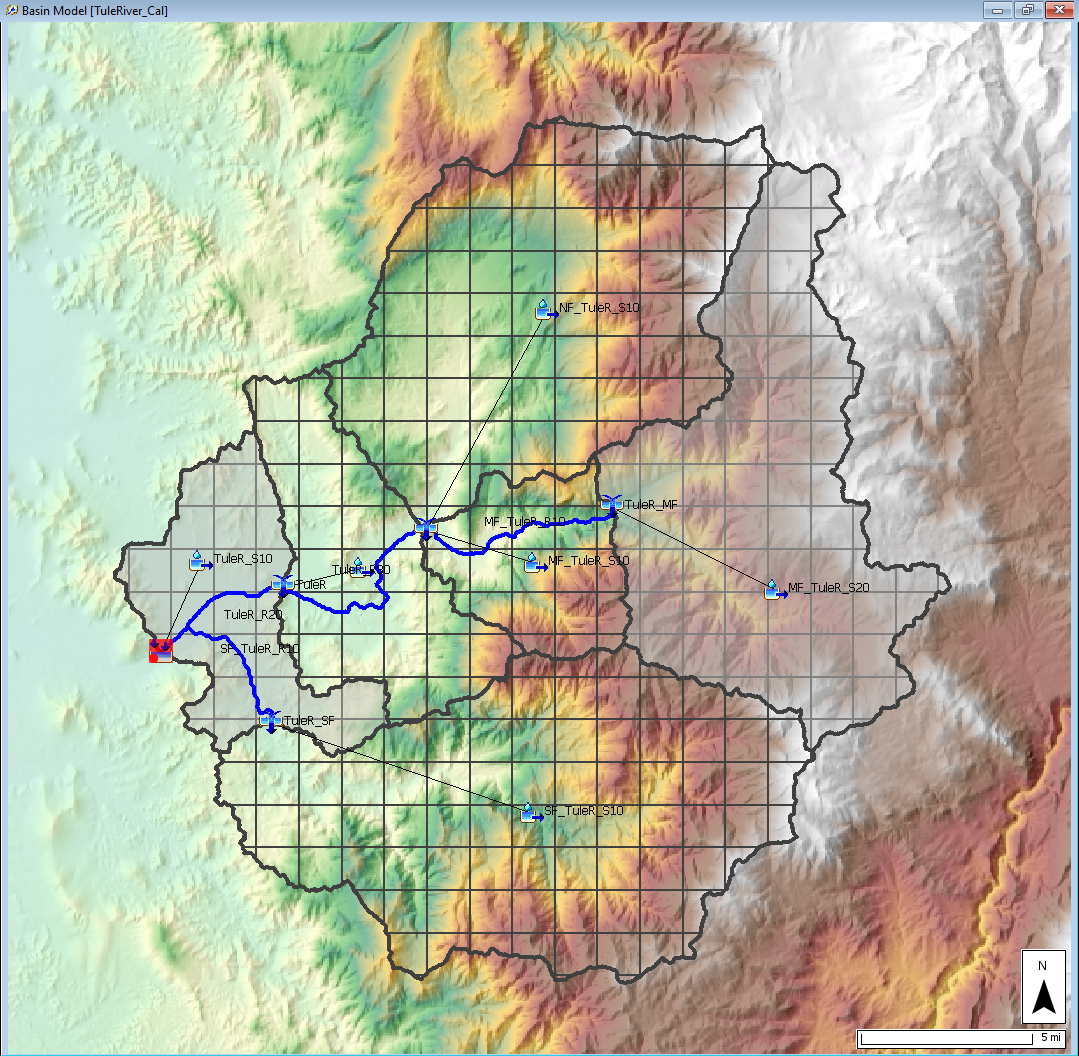
This HEC-HMS project contains a Basin Model named TuleRiver_Cal, three Control Specifications named CalibrationPeriod, ValidationPeriod, and Period of Record, two Paired Data records, and a Terrain data set. The figure below shows the watershed delineated into six subbasins. Two subbasins are highlighted. The MF_TuleR_S20 subbasin is a high elevation subbasin, the average elevation is 6286 feet, and the drainage area is 85.8 square miles. The TuleR_S10 subbasin is a low elevation subbasin, average elevation is 996 feet, and the drainage area is 32.9 square miles. As shown in the figure below, a 2000-meter discretization was used for all subbasin elements. Gridded precipitation, snow accumulation/melt, and loss computations are performed at each grid cell. Excess precipitation is routed using the ModClark transform method. A fraction of the infiltrated water is returned to the surface using the linear reservoir baseflow method.

Continue to Task 1. Download, Import, and Manipulate Gridded Data