Download PDF
Download page Task 1. Download, Import, and Manipulate Gridded Data.
Task 1. Download, Import, and Manipulate Gridded Data
Return to Introduction to the Advanced Applications of HEC-HMS Final Project
Last Modified: 2024-06-15 10:08:16.105
This tutorial demonstrates how precipitation, temperature, and SWE data were gathered and processed for the Schafer Dam HEC-HMS model.
Software Version
HEC-HMS version 4.12 was used to create this example. You can open the example project with HEC-HMS v4.12 or a newer version.
HEC-DSSVue version 3.2.3 is used to view and manipulate data within this example. You can download HEC-DSSVue here: https://www.hec.usace.army.mil/software/hec-dssvue/downloads.aspx.
Project Files
Download the initial project files here:
Allotted Time
This task should take approximately 10 minutes to complete. You are only required to read through the following steps to learn about how to download and process the boundary condition data used in the final project.
For this example, the processed precipitation and temperature data are provided for you. You are not required to reproduce these steps as part of the final project. However, if you are interested, below are the steps followed to gather and prepare the data for application in HEC-HMS. It took approximately 2 to 2.5 hours to complete the data download and processing steps.
Precipitation and Temperature Datasets
The Livneh dataset is used as the precipitation and temperature boundary conditions for this example. You can read more about this dataset, how it was created, and download these data from https://psl.noaa.gov/data/gridded/data.livneh.html. Another option is to use a script to automatically download the data.
Livneh B., E.A. Rosenberg, C. Lin, B. Nijssen, V. Mishra, K.M. Andreadis, E.P. Maurer, and D.P. Lettenmaier, 2013: A Long-Term Hydrologically Based Dataset of Land Surface Fluxes and States for the Conterminous United States: Update and Extensions, Journal of Climate, 26, 9384⦣8364;⬓9392.
Livneh daily CONUS near-surface gridded meteorological and derived hydrometeorological data provided by the NOAA PSL, Boulder, Colorado, USA, from their website at https://psl.noaa.gov.
- Here is a Livneh data retrieval script: retrieve_Livneh.py. You can run the data retrieval script using the python command prompt (it will take a significant amount of time to download the files, more than 4 hours in some cases). Python might be on your computer already as part of another program. I used the python installed as part of the ArcGIS Pro software on my computer. You can install python as a separate installation.
- You will need to create directories in C:\Temp to house the downloaded files. For example, the C:\Temp\Livneh directory was created on my computer.
- Open the Python Command Prompt.
Type "python.exe C:\Temp\retrieve_Livneh.py" to run the script (make sure you point to where the script is located on your computer).

You may need to install additional Python packages to get the script to run successfully. The packages most likely to be missing are aiohttp and nest_asyncio. You can install these packages from the Python command prompt with the following commands:
"pip install aiohttp"
and
"pip install nest_asyncio"
- As shown below, the script will create folders tmin, tmax, and prec to store the downloaded file. If you open the script with notepad, you will notice it is only set up to download data through 2010. You must manually download data from 2011 through 2018 from https://psl.noaa.gov/data/gridded/data.livneh.html.

- Open HEC-HMS and select the File | Import | Gridded Data | Importer menu option to open the Gridded Data Import Wizard.
- Choose all the precipitation NetCDF files. You will need to run through the same steps for the maximum and minimum temperature datasets.
- Choose the correct Variables. In the example below, the "prec" precipitation variable is selected.

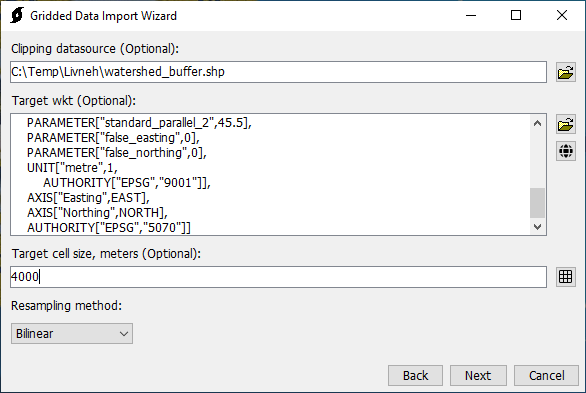
- As shown in the figure below, a Clipping datasource was selected. This step is highly recommended to keep the file size reduced. The clipping dataset was created by exporting a subbasin shapefile from the HEC-HMS project. The subbasins were merged into one bounding polygon and then buffered by 1000 feet. The SHG projection was selected by clicking the world button and choosing SHG as the selected projection. A target cell size of 4000 meters was specified. Finally, the Bilinear resampling option was selected.
- A Destination DSS file to save the gridded data was selected.
- The final step in the Gridded Data Import Wizard is critical. The program will correctly define the C-part pathname, DSS Units, and DSS Data Type for you. You do not need to override these setting when importing Livneh datasets. You can use the other DSS pathname parts to define the watershed and data source. (The HEC-HMS gridded data tools includes a Sanitizer tool than can be used to screen gridded data values. For example, missing or value greater than a specified threshold could be set to 0 to prevent simulations from aborting.)

- The temperature data provided from the Livneh website included the daily minimum and maximum temperatures. The evapotranspiration and snowmelt options in HEC-HMS require an air temperature estimate at regular time intervals. The minimum and maximum temperature data was processed using the Grid to Point tool (available in HEC-HMS from Tools | Data | Grid to Point) to compute the watershed average time-series. Then the minimum and maximum time series were averaged (using HEC-DSSVue) to generate an average temperature time-series. As part of the next task in this workshop, the watershed average temperature time-series will be interpolated to gridsets using the terrain data, a lapse rate, and the interpolation option in HEC-HMS.
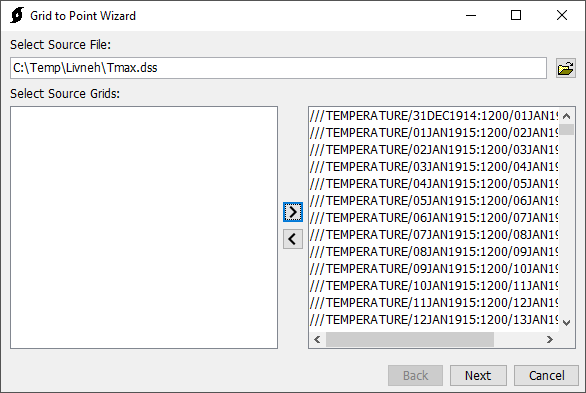
- Open HEC-HMS and go to Tools | Data | Grid to Point to open the Grid to Point tool.
- Select the Source DSS file with the grids. Then select all the grids. This step took a couple of minute because there were so many grids in the DSS file.
- A zones shapefile was selected. This is a shapefile with one polygon of the entire Schafer Dam watershed. The "name" attribute field was selected, the watershed is named TuleRiver in the shapefile.

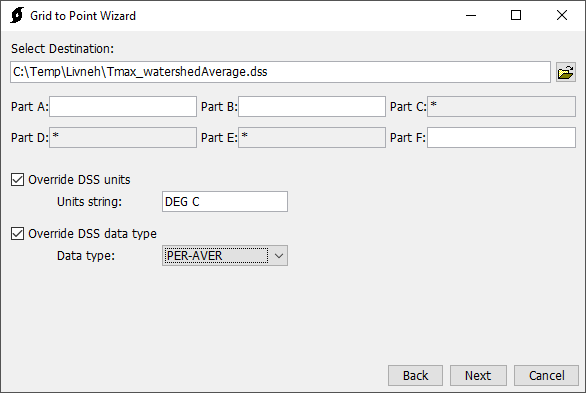
- As shown below. An output DSS file was selected and units of DEG C and a data type of PER-AVER were chosen.
- HEC-DSSVue was used to average both the minimum and maximum temperature time-series. It took two steps.
- Both time series were selected and the Math Functions editor was opened. As shown below, the Add operator on the Arithmetic tab was selected and the Max and Min datasets were added to one another. A new dataset was created.

- The dataset created in the prior step was selected and the Math Functions editor was opened. As shown below, the Max+Min dataset was divided by 2 and saved as a new dataset with an F-part of Average.

- The following figure shows the minimum, maximum, and average watershed average temperature time-series from the Livneh dataset.

- Both time series were selected and the Math Functions editor was opened. As shown below, the Add operator on the Arithmetic tab was selected and the Max and Min datasets were added to one another. A new dataset was created.
Snow Water Equivalent Dataset
Snow Water Equivalent (SWE), monthly average streamflow, and annual maximum peak flow information will be used to evaluate model performance. The University of Arizona SWE dataset (https://nsidc.org/data/nsidc-0719/versions/1#anchor-2) was used as “observed” SWE within the example project. The gridded SWE data for water years 1983 - 2002 (this is the calibration and validation period) was manually downloaded from https://climate.arizona.edu/data/UA_SWE/. Just like the Livneh temperature dataset, the University of Arizona SWE dataset was processed using the HEC-HMS Gridded Data Importer and Grid to Point tools. The HEC-HMS Grid to Point tool was only used to process the gridded University of Arizona SWE dataset for the MF_TuleR_S20 subbasin. The subbasin average University of Arizona SWE time-series will be added to the HEC-HMS as an "observed" SWE gage and linked to the MF_TuleR_S20 subbasin element.
Reference for University of Arizona SWE Dataset
Broxton, P., X. Zeng, and N. Dawson. (2019). Daily 4 km Gridded SWE and Snow Depth from Assimilated In-Situ and Modeled Data over the Conterminous US, Version 1 [Data Set]. Boulder, Colorado USA. NASA National Snow and Ice Data Center Distributed Active Archive Center. https://doi.org/10.5067/0GGPB220EX6A. Date Accessed 08-25-2022.
Continue to Task 2. Calibrate the Model for Water Years 1983-1992