Download PDF
Download page Calibrate the Dynamic Surface Method Parameters.
Calibrate the Dynamic Surface Method Parameters
The Dynamic Surface method should be calibrated to improve the simulated hydrograph results. In this task, you will modify the Surface and Loss layer parameters in a systematic way to improve the fit of simulated results to the observed discharge.
Post-fire Simulation with Dynamic Surface: 1 year
- First, adjust the Max Storage and re-compute the results.
- Increase the Max Storage to 1 in and rerun.
Decrease the Max Storage to 0 in and rerun.
QUESTION 1: What effect does reducing the Max Storage have on the simulated hydrograph?Increasing the Max Storage reduced the volume of runoff while reducing the Max Storage increased the volume of runoff. In addition, reducing the Max Storage improved the model performance. Changing the Max Storage from 0.5 in to 0 in, without modifying any other parameters changed the percent bias from -19% to -3.5%. A Max Storage value of 0 inches means that no volume is held in storage in the Surface layer.
- Adjust the Rain Intensity Threshold and re-compute the results.
- Increase the Rain Intensity Threshold to 2 in/hr and rerun.
- Decrease the Rain Intensity Threshold to 0.05 in/hr and rerun.
- Adjust the Dry Duration and re-compute the results.
- Increase the Dry Duration to 1440 min and rerun.
Decrease the Dry Duration to 360 min and rerun.
QUESTION 2: What effect does changing the Rain Intensity Threshold and Dry Duration have on the simulated hydrograph?Changing the Rain Intensity Threshold and Dry Duration parameters had little impact on the simulated hydrograph results. Most rainfall events during this 1-year period had an intensity of greater than or equal to 0.1 in/hr. These parameters will be re-visited during the 3 and 10 year simulation periods.

- Adjust the Initial Rate and re-compute the results.
- Increase the Initial Rate to 0.2 in/hr and rerun.
- Decrease the Initial Rate to 0.1 in/hr and rerun.
QUESTION 3: What effect does changing the Initial Rate have on the simulated hydrograph?
Reducing the Initial Rate to 0.1 in/hr produced too much runoff in December 2009 - January 2010. Increasing the Initial Rate to 0.2 in/hr caused too much volume to infiltrate and underpredicted runoff during the 2009-2010 winter season. Therefore, the Initial Rate of 0.15 in/hr, obtained from calibration of the January 2010 event, was used.
Maximum Rate
The Maximum Rate will be calibrated in the following task using longer simulation periods of 3 and 10 years. The Maximum Rate is the Surface layer infiltration rate that the soil recovers to after 10 years. The Surface layer infiltration rate recovers very little during the first year post-fire so the results of the 1 year simulation are insensitive to the Maximum Rate.
Post-fire Simulations with Dynamic Surface: 3 and 10 years
- To calibrate the Maximum Rate, create 2 additional simulations: one spanning 3 years post-fire (16OCT2009 - 31SEP2012) and one spanning 10 years post-fire (16OCT2009 - 31SEP2019).
- Within the Components tab, select the Control Specifications node. Right click on the DynamicSurface_1yr control specification and select Create Copy.
- Enter PostFire_3yr as the control specification name. Click the Copy button.
- Expand the node for the PostFire_3yr control specification and change the End Date to 01OCT2012. Leave the remaining fields unchanged. The Control Specifications should appear as in the figure below. Click the Save button.

- Repeat the previous steps to create a PostFire_10yr control specification with an End Date of 01OCT2019. Leave the remaining fields unchanged. The Control Specifications should appear as in the figure below.

- Create 2 additional simulation runs named PostFire_DySurf_3yr and PostFire_DySurf_10yr with the following selections:
- Basin Model: PostFire_DynamicSurface
- Meteorologic Model: LAPW_Interp_PRISM_Bias
- Control Specification: PostFire_3yr or PostFire_10yr
Check that the Simulation Run selections match the figures below.

- Compute the PostFire_DySurf_3yr and PostFire_DySurf_10yr simulations.
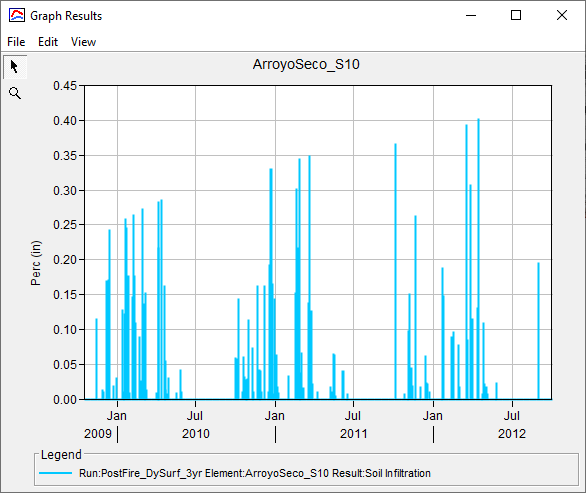
Open the Graph and Summary Results for the Outlet to view the results. In addition, plot the Soil Infiltration time series (shown below). The Surface layer constant loss rate is always less than or equal to the Loss layer constant loss rate. As a result, the infiltration of water into the soil is limited by the Surface layer, rather than the underlying soil (described by the Loss layer). Therefore, the Soil Infiltration time series plot shows the Surface layer infiltration rate. Keep these windows open to assist with calibration.

Plot Properties
You can edit the linestyle (e.g. color, symbol, etc) of a time series by clicking Edit | Plot Properties.
- Adjust the Rain Intensity Threshold, Dry Duration, and Maximum Rate one at a time and re-compute the results. Make sure to change the Loss layer Constant Rate value to match the Surface layer Maximum Rate.
- Use the magnifying glass button
 in the Graph window to zoom into a subset of the simulation time period.
 - To re-compute multiple simulations in series, select Compute | Multiple Compute.... Check the boxes next to the simulations you want to run and click the Compute button.

QUESTION 4: How did adjustment of the Max Storage, Rain Intensity Threshold, and Dry Duration parameters impact the 3- and 10-year simulation results?
To improve the calibrated results in the 3- and 10-year simulations, the Max Rate parameter was increased from 0.4 in/hr to 0.5 in/hr including Constant Rate in Loss Tab. The Rain Intensity Threshold was decreased from 0.2 in/hr to 0.1 in/hr to include lower intensity precipitation events in the recovery of the surface layer. The simulated results were insensitive to the Dry Duration. Therefore, the original Dry Duration value of 720 min was used. The calibrated Dynamic Surface parameters and the results from the 1-, 3-, and 10-year simulations are shown below.


Continue to Comparison of Post-fire Simulations with and without Dynamic Surface.