Download PDF
Download page Data Compilation.
Data Compilation
The following tasks have already been completed for you. Please review them so you are familiar when applying to your own study.
HEC-HMS version 4.12-beta.5 was used to create this tutorial. You will need to use HEC-HMS version 4.12, or newer, to open the project files.
Download the initial model files here:
Find Historic Events
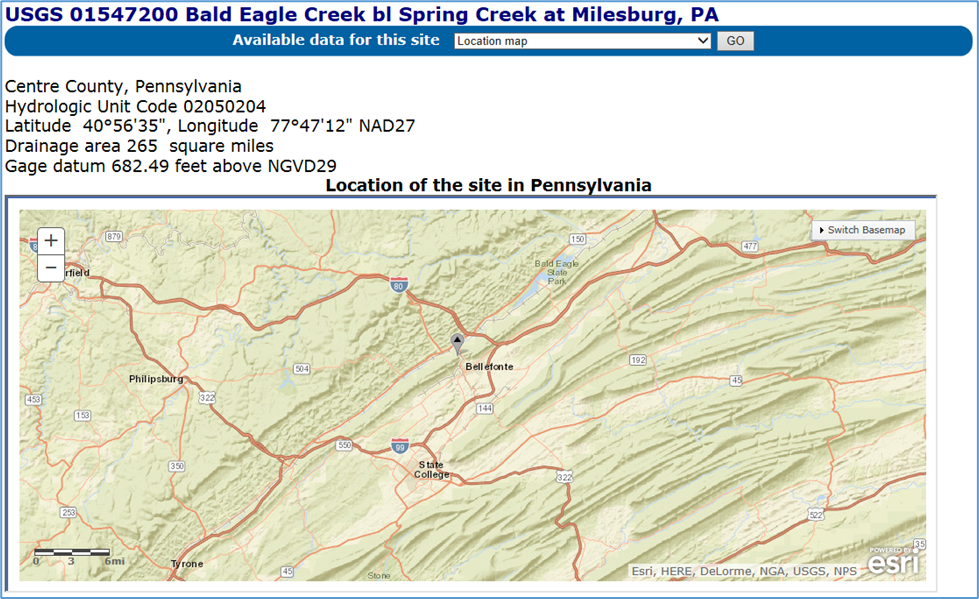
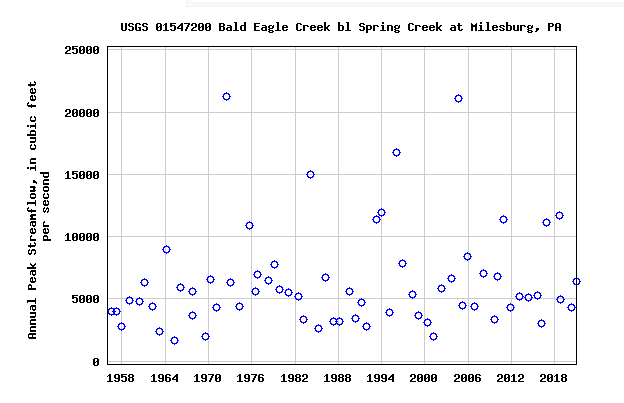
Based on information from the USGS website (https://waterdata.usgs.gov/nwis), there is one gage above Sayers Dam on Bald Eagle Creek. The USGS provides the latitude and longitude for the gage on the website and the below figure shows its location with the gray marker (access the National Water Information System Mapper at https://maps.waterdata.usgs.gov/mapper/index.html). The drainage area to the gage is 265 square miles and the drainage area to the dam is 339 square miles (28% larger) based on data on the Bald Eagle Creek at Blanchard, PA stream gage just below the dam. The USGS gage has 60 years of peak flows with the 1972, 2004, and 1996 ranking as the largest on record as seen in the second figure. These are the three events used in this workshop.
Find Hydrograph and Hyetograph Data for the Selected Events
- The events used to determine unit hydrographs will depend on the data (both streamflow and precipitation) available.
- Streamflow data for the 1972 event was provided in the reservoir regulation manual.
- Streamflow data for the 2004 and 1996 events were gathered from the USGS and USACE Corps Water Management System (CWMS) database.
- You should do a quick check of the quality of your data.
- Hourly streamflow data were available for the September 2004 and January 1996 events from the CWMS database.
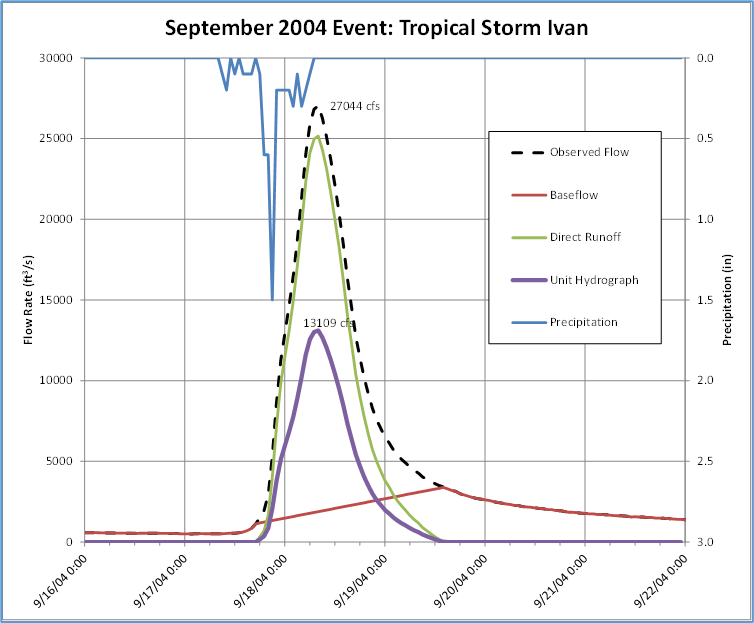
- However, the peak of the 2004 event in CWMS (23,267 cfs) did not match the peak reported by the USGS (21,100 cfs) due to the use of an older rating curve in CWMS.
- To correct for this, all the flows for the 2004 event were scaled down so the peak flow equaled the USGS record.
- In reality, the problem with the rating curve is likely an issue with the higher flows only, but this example modifies all the flows for simplicity.
- As noted earlier, the gage is upstream of the dam so the flows at the gage need to be scaled to better represent flows at the dam.
- For a PA level study and for this example, a scaling factor was developed from the 1972 peak flow at the upstream gage and at the dam and then was applied to all flows at the gage.
- Observed precipitation information is required to determine the duration of the unit hydrograph.
- Find precipitation data for the 2004 and 1996 events on the National Climatic Data Center (NCDC) website (access a map viewer with hourly precipitation gages at https://www.ncei.noaa.gov/maps/hourly/).
- In the case of the Sayers Dam site there are several precipitation gages upstream of the dam with hourly precipitation data for the dates needed.
- Given the size of this watershed and the amount of data available, a detailed analysis would incorporate precipitation from several gages.
- For this example and a Periodic Assessment level of study, sample rainfall depths from a handful of gages. Three gages that appear to fall within the watershed boundary:
- Tyrone, PA
- Philipsburg 8 E, PA
- Hollidaysburg 2 NW, PA
- Finding precipitation gages that recorded adequate precipitation depths and a representative time pattern can be challenging.
Refer to EM 1110-2-1417 for a detailed discussion about developing a calibrated model. For a Periodic Assessment level of study, verification that the precipitation gage recorded more than 80% of the runoff volume and that the time pattern supports the timing of the runoff hydrograph should be adequate.
- Determination of initial loss and constant loss values should not be a time-consuming exercise.
- Initial losses can be based qualitatively on the duration since the previous precipitation event, and time of the onset of precipitation and the onset of the rising limb of the runoff hydrograph.
- Constant loss rates can be based on historic studies.
If acceptable flow and precipitation data had not been available for both the 2004 and 1996 events of this workshop, then another historic event should be selected with guidance from the ranking of the peak flows at the gage.
Remove Hydrograph Baseflow
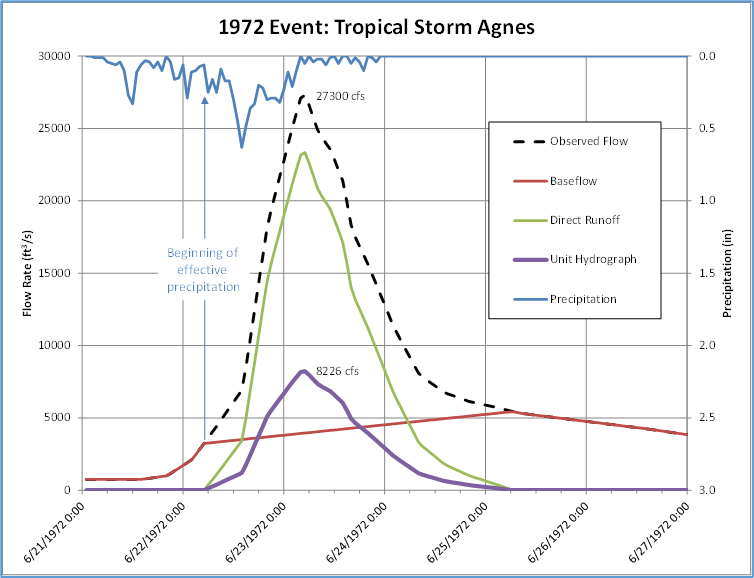
Baseflow can be removed using several different methods. In general, the choice of method is negligible if the hydrograph is an historic event. One simple graphical method for separating baseflow from an observed hydrograph is called the "straight-line" method. With this method, a line is drawn from the point on the rising limb where direct runoff begins and the point on the receding limb where normal baseflow resumes. In the case of the 1972 event, assume that the surface runoff begins on 6/22/1972 at 6:00 AM and that the normal baseflow resumes (surface runoff ends) at 6/25/1972 at 6:00 AM. A straight line can then be drawn between these two points to separate baseflow (area underneath the line) from direct runoff (area above the line). This is demonstrated in the figures shown below.
Scale the Observed Flood Hydrographs to Produce a Unit Hydrograph
- Scale the observed flood hydrographs (without baseflow) so the volume under each of the hydrographs is equivalent to 1 inch.
- Do this by determining the total runoff volume under the flood hydrograph in inches and dividing all of its ordinates by this volume.
- In the case of the 1972 event, the volume of direct runoff under the hydrograph is 2.84 inches.
- This means all the flows of the 1972 flood are 2.84 times larger than those of the unit hydrograph.
- Dividing all the ordinates by 2.84 reduces the flows to those that have 1 inch of volume under the resulting hydrograph.
- The volume under the resulting unit hydrograph should be checked to ensure it is 1 inch.
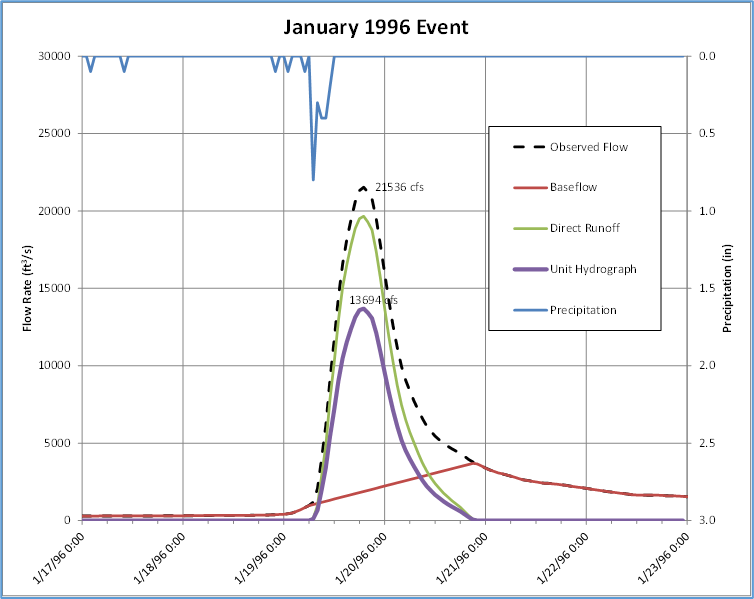
- The three figures below show the 1972, 2004, and 1996 flood hydrographs for Sayers Dam.
- Included in the figures are the precipitation hyetographs, baseflow hydrographs, direct runoff hydrographs, and the resulting unit hydrographs for the flood events.
- The spreadsheet used to compute the unit hydrographs is named Unit Hydrographs.xlsx and can be found in the data folder located within the HEC-HMS model project directory.
- You can open this spreadsheet to get an idea of how to manually compute the unit hydrograph for a flood event and check its volume.
Determine Unit Hydrograph Durations
The unit hydrograph duration is the duration of the effective rainfall that produced the hydrograph. Determining the effective rainfall is subjective. In this example, the effective rainfall was assumed to begin just before when the baseflow and observed flow lines diverge and end when the precipitation drops sharply back to lower values (the total depth of excess precipitation should be equal to the direct runoff volume). This results in a 20-hour unit hydrograph for the 1972 flood, a 10-hour unit hydrograph for the 2004 flood, and a 3-hour unit hydrograph for the 1996 flood.
Continue to Compute a Synthetic Unit Hydrograph for Several Historical Events.
