Download PDF
Download page Simulating the PMF Using the Clark Method.
Simulating the PMF Using the Clark Method
HEC-HMS version 4.12-beta.5 was used to create this tutorial. You will need to use HEC-HMS version 4.12, or newer, to open the project files.
According to ER 1110-8-2, the “reservoir inflow unit hydrograph should be peaked by 25-50 percent” to account for the fact that the model was calibrated to floods less extreme than the PMF. The Clark unit hydrograph method was used to transform excess precipitation to runoff hydrographs while the Muskingum channel routing routine was used to route flows from the Bald Eagle at Milesburg junction to the Sayers Dam reservoir element.
Peaking the Unit Response
HEC-HMS can be used to peak the unit response at the dam by configuring a Meteorologic Model containing 1-inch of precipitation and modifying a Basin Model so that there are no losses or baseflow and only direct runoff is simulated.
- Create a copy of the PMF_UH_peak25 Basin Model and name the copy Peak_25P.
- Open the Peak_25P Basin Model and set each subbasin Loss Method and Baseflow Method to None (only direct runoff will be computed).
You can quickly change the chosen loss method for each subbasin in the selected Basin Model by clicking Parameters | Loss | Change Method. This process can be repeated to quickly set the Baseflow method to None.
- Enter the average Tc and R Clark unit hydrograph parameters that were previously computed for the Spring Creek, Bald Eagle HW, and Reservoir Local subbasins.
- Enter a Muskingum K of 3 hours and a Muskingum X of 0.25 for the Bald Eagle 40 routing reach. Set the number of subreaches to 12 (an approximation for subreaches =\frac{K}{\Delta t}).
- Add a new Precipitation gage to the project named 1-inch 1 hour.
- The Units should be set to Incremental Inches and the Time Interval set to 1 Hour.
- Set the Start Date and Start Time to 01Jan1999 00:00 and the end date and time to 02Jan1999 01:00.
- Go to the Table tab and enter 1 inch of precipitation on 01Jan 1999, 01:00.
- Fill the rest of the table with 0 inches.
You can quickly perform this operation by first selecting the cells of interest, right-clicking, and selecting Fill | Repeat first Value.
- Create a Meteorologic Model named 1-inch.
- Make sure the Replace Missing Option is set to Set to Default
- Select Specified Hyetograph as the Precipitation method.
- Click on the Basins tab and link the Meteorologic Model to the Peak_25P Basin Model.
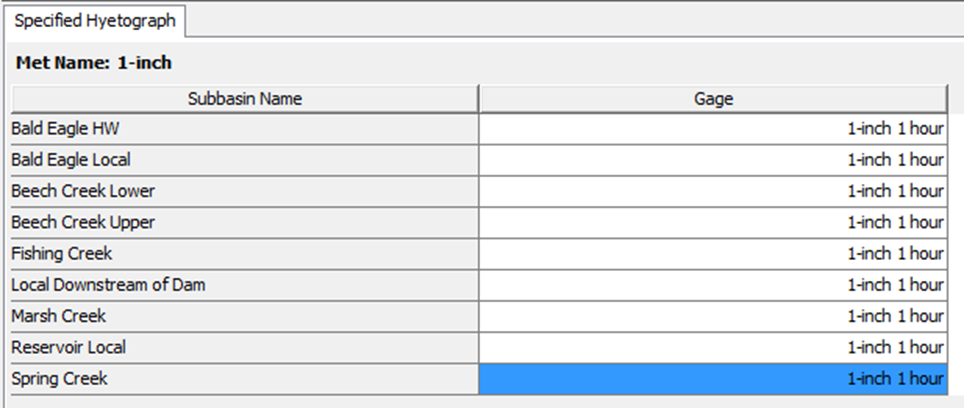
- Finally, expand the 1-inch Meteorologic Model and select Specified Hyetograph. Associate the 1-inch 1 hour precipitation gage to each subbasin on the Specified Hyetograph tab, as shown in the following image.

- Create a simulation run named Peak Unit Response 25P.
- Use the Peak_25P Basin Model, 1-inch Meteorologic Model, and PMF Event Control Specifications.
- Run the Peak Unit Response 25P simulation and view results for the Sayers Dam reservoir element.
- To view results, right-click on the Sayers Dam reservoir element and select View Results | Time-Series Table.
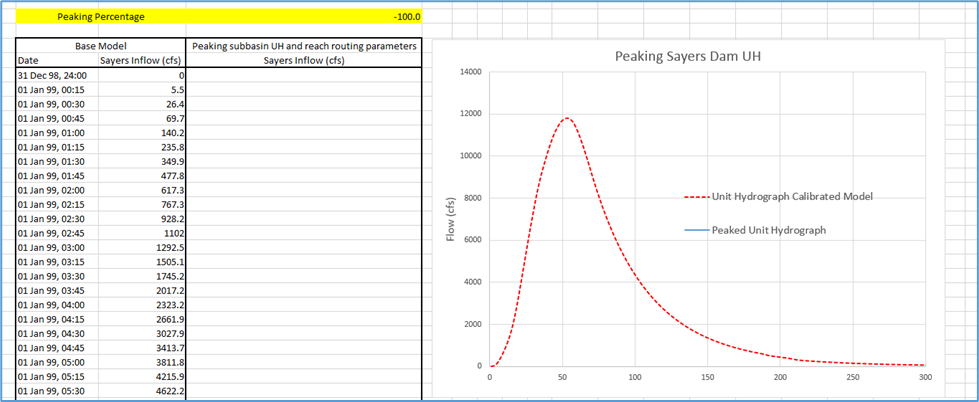
- Tabulate the Inflow time-series at Sayers Dam and copy/paste the time-series into the Peaking UH spreadsheet located within the workshop folder.
- The inflow time-series should be copied in Column C.
- The plot will updated as shown in figure below, the peak flow for the unit hydrograph at Sayers Dam is approximately 12,000 cfs.

The hydrograph computed in this step is the unit hydrograph for the watershed upstream of Sayers Dam. For an actual analysis, it would be better to have a separate Basin Model and simulation for the base (un-peaked) scenario.
- Next, adjust the unit hydrograph and routing reach parameters until you achieve a 25-percent peaked unit response at Sayers Dam.
- Reduce the Tc and R parameters for the Spring Creek, Bald Eagle HW, and Reservoir Local subbasins by 25% (i.e., multiply each parameter by 0.75).
You can quickly perform this operation by first opening the Clark Unit Hydrograph Global Editor (Parameters | Transform | Clark Unit Hydrograph). Then, select the cells of interest and Right-click | Fill | Multiply by a Constant.
The Tc parameter controls the hydrograph timing and the R parameter controls the hydrograph shape (but also timing to some degree). Both parameters are influenced by similar watershed characteristics, slope, flow path, roughness, and storage to name a few.
- Reduce the Muskingum K parameter in the Bald Eagle 40 routing reach by 25%.
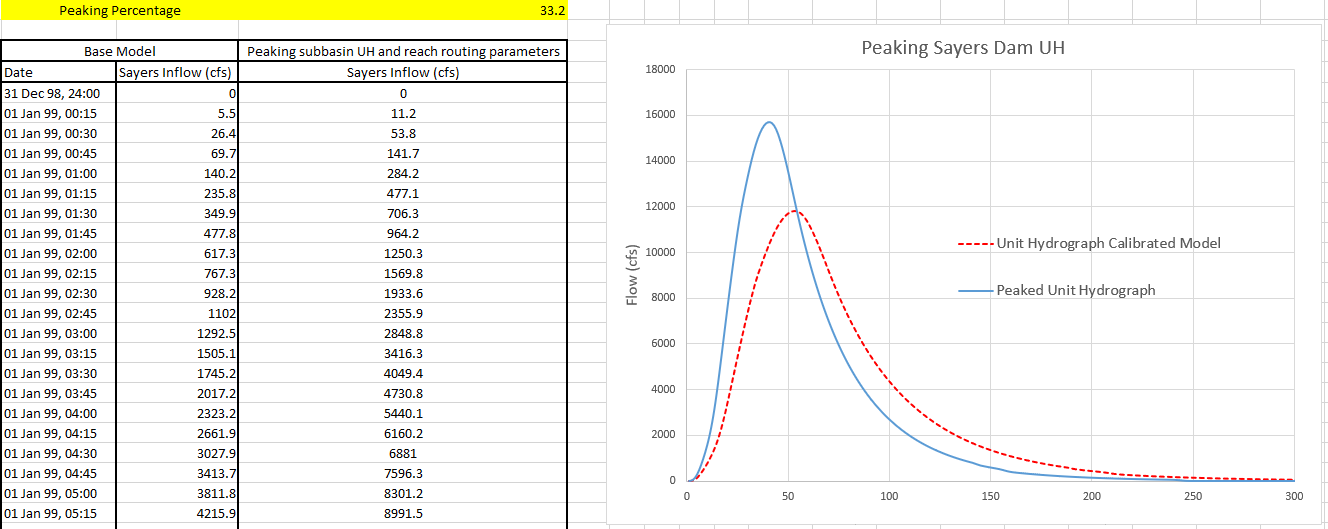
- Rerun the Peak Unit Response 25P simulation and copy the updated Sayers Dam inflow time-series results into Column D in the spreadsheet.
- The plot will update showing the original and “peaked” unit hydrograph, as shown below.
- Cell D2 shows the percentage that the unit hydrograph was peaked.

- Continue adjusting the Tc, R and Muskingum K parameters until the peak inflow increases by the desired percentage.
Question 5: What ratio did you use to reduce the Tc, R, and Muskingum K parameters to increase the unit hydrograph at Sayers Dam by 25 percent?The ratio used to reduce Tc, R and K was 0.8. This resulted in the following parameter values:
Basin
Tc (hr)
R (hr)
Spring Creek
10.4
10.6
Bald Eagle HW
8.8
6.4
Reservoir Local
6.4
6.4
Reach K (hr) Bald Eagle 40 2.4
- Reduce the Tc and R parameters for the Spring Creek, Bald Eagle HW, and Reservoir Local subbasins by 25% (i.e., multiply each parameter by 0.75).
Transfer the unit hydrograph and routing reach parameters to the PMF_UH_Peak25 Basin Model.
Populate the loss parameters for the three subbasins upstream of Sayers Dam.
Use the minimal Constant Loss Rate values that were previously determined in the Review the Existing HEC-HMS Project tutorial.
Set the Initial Loss to 0.5 inches (assumption of an antecedent storm).
Update the Impervious Area for the three subbasins of interest:
- Spring Creek = 2.3%
- Bald Eagle HW = 0%
- Reservoir Local = 7.7%
For this subbasin, the impervious area parameter is accounting for rain falling on the pool. An increase in the impervious area is needed for the PMF simulation because the surface area of the pool is almost double when it is at the spillway crest as compared to the normal conservation pool elevation.
Create a simulation named PMF Peak 25P.
Use the PMF_UH_peak25 Basin Model, PMP Meteorologic Model, and PMF Event Control Specifications.
Look at results for Sayers Dam by selecting the Sayers Dam reservoir element in the map and pressing the Summary Results Button,
 .
.These buttons are only active if the simulation run has been computed and a Basin Model element is selected.
You can also see results by navigating to the Results tab and expanding the PMF Peak 25P simulation.
Question 5: What was the peak inflow and outflow during the PMF simulation at the Sayers Dam reservoir element?The peak inflow was approximately 241,000 cfs while the peak outflow was approximately 205,000 cfs.
Question 6: The top elevation of Sayers Dam is 683 ft. Was Sayers Dam overtopped during the PMF simulation? If the dam was not overtopped, how much freeboard is available?Peak pool elevation was approximately 677 ft. The dam was not overtopped. There was approximately 6 feet of freeboard.
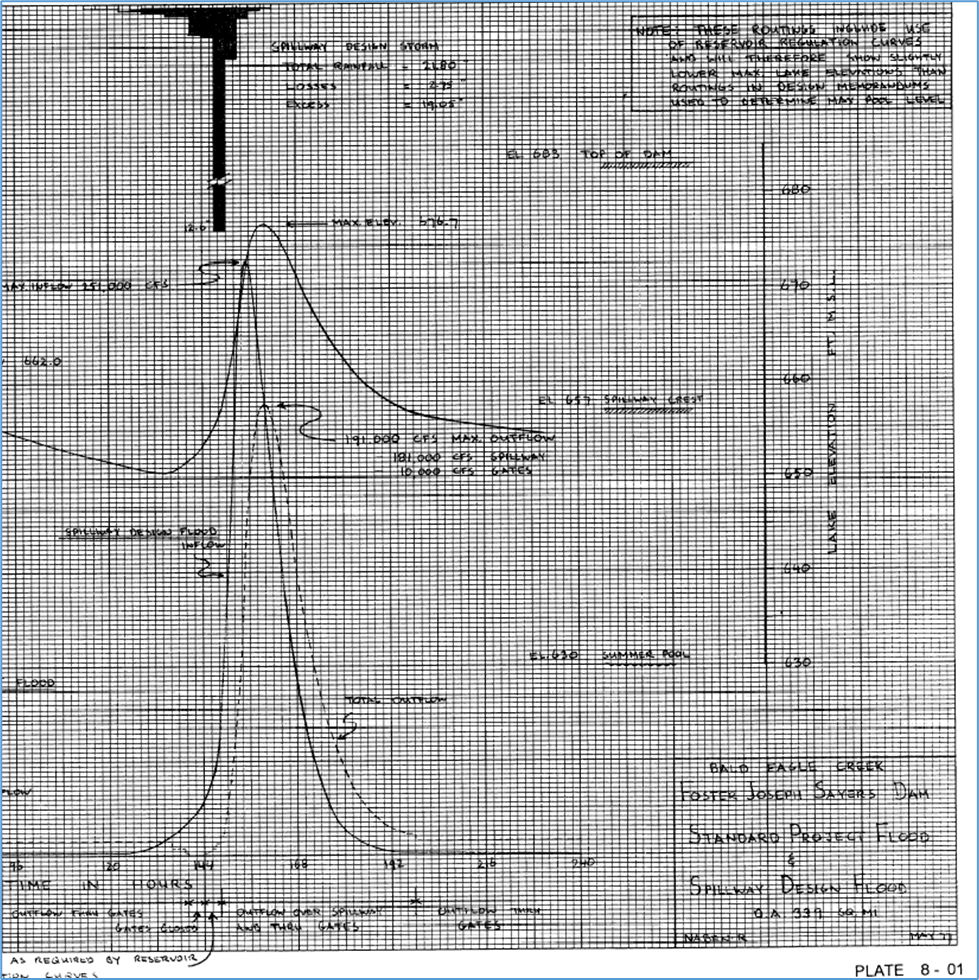
Question 7: The figure below shows the original Spillway Design Flood (SDF) for Sayers Dam. The SDF contained 21.8 inches of precipitation in 48 hours (12.6 inches in the maximum 3-hours). The peak flow was 251,000 cfs and the runoff volume was 19.05 inches. How is the current PMF simulation different than the original SDF?
The updated PMF has a smaller peak inflow while the runoff volume increased when compared against the SDF. The peak flow decreased from 251,000 cfs to 241,000 cfs using updated procedures. The direct runoff value also increased from approximately 19.1 to 22.5 inches. The PMP used in this example is less intense (~10.5 inches in the maximum 3 hours) but carries more volume overall (~23.6 inches of precipitation in 48 hours).
Download the final model files here:
This page concludes the Estimating the PMF Using an Existing Model tutorial group.
