PDF
Download PDF
Download page Hydrologic Routing of Reservoir Inflow and Outflow.
Hydrologic Routing of Reservoir Inflow and Outflow
Overview
This tutorial will provide an example of calculating unregulated time-series by routing the reservoir inflow and outflow using a simple hydrologic model.
The general procedure to route reservoir inflow and outflow is:
- Route the reservoir inflow to a downstream gage of interest.
- Route the reservoir outflow to the same downstream gage.
- Determine the runoff hydrograph emanating from the drainage area in between the dam and the gage of interest ("local flow hydrograph") using the following equation:
- Local\,Flow\,at\,Gage = Observed\,Flow\,at\,Gage - Routed\,Reservoir\,Outflow
- Add the routed reservoir inflow hydrograph to the local flow hydrograph at the gage to obtain the unregulated streamflow hydrograph:
- Unregulated\,Flow\,at\,Gage = Local\,Flow + Routed\,Reservoir\,Inflow
Route the Reservoir Inflow
- Download the Lehigh River HEC-HMS model and unzip the file.
- Start HEC-HMS (version 4.12 beta 6 or newer) and open the Lehigh_River_HMS project (top of this page). Expand the Basin Model folder in the Watershed Explorer and click on the Lehigh_Stick basin model. The basin model map should look like the figure below. Notice that the basin model does not have any subbasin elements. In addition, observed streamflow is not linked to the Tannery, MudCF, or BlackCF junction elements. This model was originally developed for use in the Corps Water Management System (CWMS).
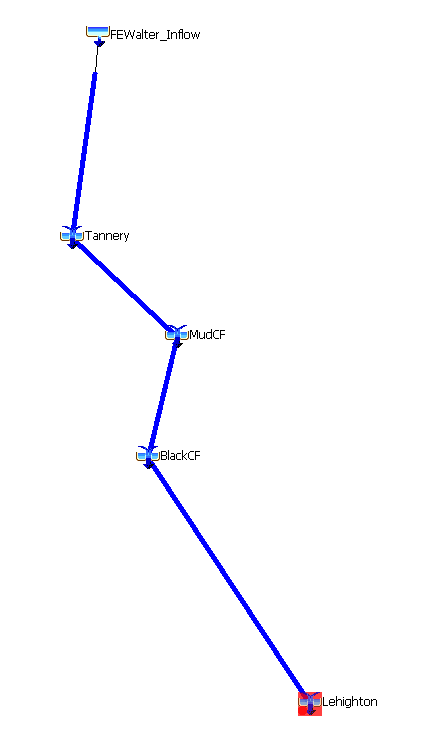
- Select the FEWalter_Inflow source element. Navigate to the Inflow tab. The inflow gage is set to time series discharge record named FEWalter_Inflow.
- Create a Control Specification by selecting Components | Control Specifications Manager. Click the New... button. Name the control specification WY1991-2020 and click the Create button. Close the Control Specifications Manager window.
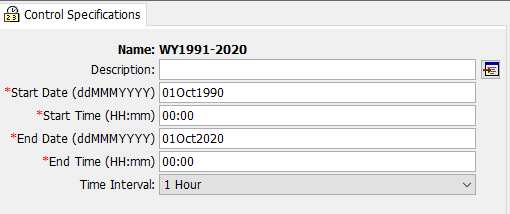
- Expand the Control Specifications folder in the Watershed Explorer. Click on the control specification you just created and enter the following start date/time and end date/time:
- Start Date: 01OCT1990
- Start Time: 00:00
- End Date: 01OCT2020
- End Time: 00:00
- Change the Time Interval to 1 Hour. Click the save button
 from the top ribbon. The Control Specifications panel should resemble the figure below.
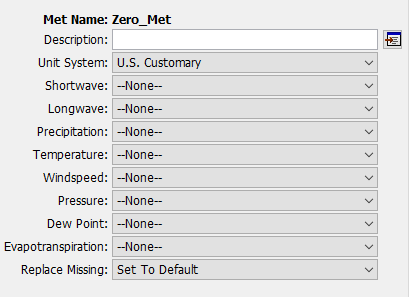
- Create a Meteorologic Model by selecting Components | Meteorologic Model Manager. Click the New... button. Name the meteorologic model Zero_Met and click the Create button. Close the Meteorologic Model Manager window.
- Select the Zero_Met meteorologic model and set all methods to "--None--." The Meteorology Model panel should resemble the figure below. No meteorology is needed for this analysis since runoff was measured by the gages as streamflow. However, a HEC-HMS simulation requires a Meteorology Model.
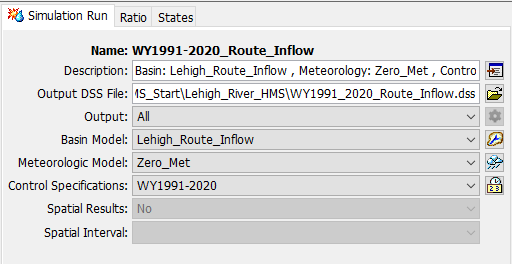
- Create a Simulation Run by selecting Compute | Create Compute | Simulation Run. Name the run WY1991-2020_Route_Inflow and select the Next button. Select the Lehigh_Route_Inflow basin model, the Zero_Met meteorologic model, and the WY1991-2020 control specifications on the following screens. Select the Finish button.
- Select the Compute tab in the Watershed Explorer and expand the Simulations Runs folder in the Watershed Explorer. Select the WY1991-2020_Route_Inflow simulation run. Check that the simulation settings match the figure below.
- Select the WY1991-2020_Route_Inflow simulation from the Compute Selection Box in the Toolbar, as shown below.

- Click the Compute button
 to run the simulation. The simulation should take approximately 40 seconds to finish.
Route the Reservoir Outflow
- Create a new basin model by right clicking on the existing one and selecting Create Copy. Name the new basin model Lehigh_Route_Outflow and click the Copy button.
- Rename the FEWalter_Inflow source element by right clicking on it and selecting Rename. Enter FEWalter_Outflow as the new name.
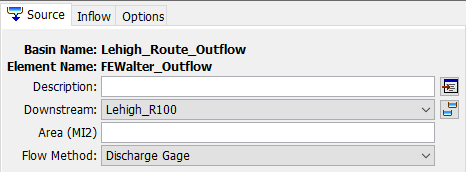
- In the Watershed Explorer, select the FEWalter_Outflow source element. In the Component Editor, click the Source tab and make sure that Discharge Gage is selected as the Flow Method drop-down menu, as shown in the figure below.
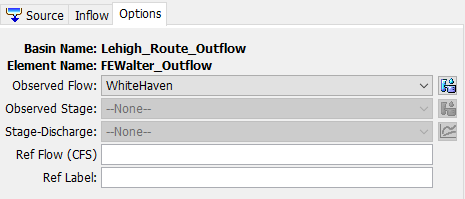
- Navigate to the Inflow tab and select WhiteHaven from the Discharge Gage drop-down menu, as shown in the figure below. Remember that we are using the discharge measured as WhiteHaven as a proxy for the reservoir outflow.
- Save the project.
- Select the Compute tab from the Component Editor. Expand the Simulations Runs folder and right click on the WY1991-2020_Route_Inflow simulation. Click Create Copy. and name the new simulation WY1991-2020_Route_Outflow.
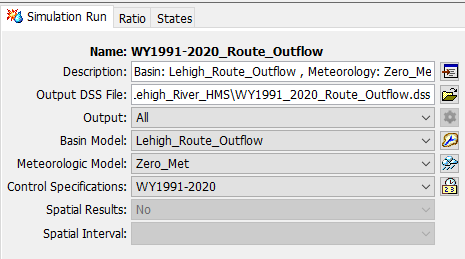
- Expand the new simulation run and select the Lehigh_Route_Outflow basin model from the Basin Model drop down menu. Check that the simulation settings match the figure below.
- Click the Compute button to run the simulation. The simulation should take approximately 40 seconds to finish.
Compute Local and Unregulated Flow at the Lehighton Gage
- Open HEC-DSSVue.
- Create a new DSS file by selecting File | New Vers 7. Name the file Lehigh_River_Streamflow_Calcs.dss.
- Navigate to the HEC-HMS project directory and open the following files: WY1991_2020_Route_Inflow.dss and WY1991_2020_Route_Outflow.dss.
- Navigate to the following DSS records using the DSS part filters:
- File: WY1991_2020_Route_Outflow.dss, Record Name: //LEHIGHTON/FLOW-OBSERVED/30Sep1990 - 30Sep2020/1HOUR/RUN:WY1991-2020_ROUTE_OUTFLOW/
B-part: LEHIGHTON, C-part: FLOW-OBSERVED
Note: The Lehighton FLOW-OBSERVED record in both DSS files is the same since this record corresponds to the observed gage record provided to HEC-HMS.
- File: WY1991_2020_Route_Outflow.dss, Record Name: //LEHIGHTON/FLOW/30Sep1990 - 30Sep2020/1HOUR/RUN:WY1991-2020_ROUTE_OUTFLOW/
- B-part: LEHIGHTON, C-part: FLOW
- File: WY1991_2020_Route_Inflow.dss, Record Name: //LEHIGHTON/FLOW/30Sep1990 - 30Sep2020/1HOUR/RUN:WY1991-2020_ROUTE_INFLOW/
- B-part: LEHIGHTON, C-part: FLOW
- File: WY1991_2020_Route_Outflow.dss, Record Name: //LEHIGHTON/FLOW-OBSERVED/30Sep1990 - 30Sep2020/1HOUR/RUN:WY1991-2020_ROUTE_OUTFLOW/
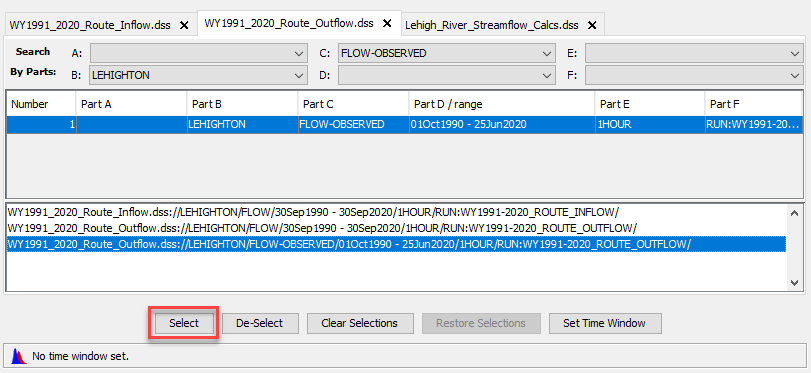
- Select the DSS records by double clicking on them or clicking the Select button (shown in a red box in the figure below).
- Select Edit | Copy To from the top ribbon, as shown in the figure below.
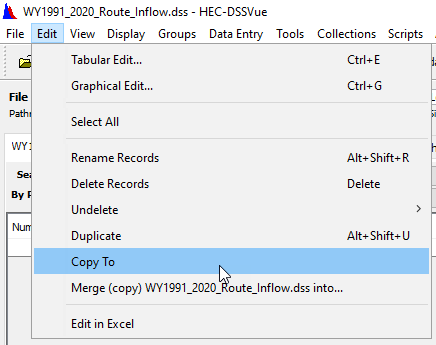
- Navigate to the Lehigh_River_Streamflow_Calcs.dss file and click the Open button. A window will appear indicating that the records have been copied. Click the OK button.
- Close the WY1991_2020_Route_Inflow.dss and WY1991_2020_Route_Outflow.dss files. Click the Clear Selections button.
- Within the Lehigh_River_Streamflow_Calcs.dss files, click the F5 keyboard button to refresh the catalog. The DSS catalog should resemble the figure below.

- Right click the FLOW-OBSERVED record and select Duplicate. Change the C-part to FLOW-LOCAL and the F-part to COMPUTED. Click the OK button.
- Double click the following records:
- //LEHIGHTON/FLOW/30Sep1990 - 30Sep2020/1Hour/RUN:WY1991-2020_ROUTE_OUTFLOW/
- //LEHIGHTON/FLOW-LOCAL/30Sep1990 - 30Sep2020/1Hour/COMPUTED/
- Select Tools | Math Functions from the top ribbon.
- On the Arithmetic tab, select the FLOW-LOCAL record in the Selected Data Set drop down menu.
- Select Subtract from the Operator drop-down menu.
- Select the Data Set radio button and the FLOW record in the selection box.
- The Math Functions tab should look like the figure below. This selection will perform the following computation: Local\,Flow\,at\,Gage = Observed\,Flow\,at\,Gage - Routed\,Reservoir\,Outflow
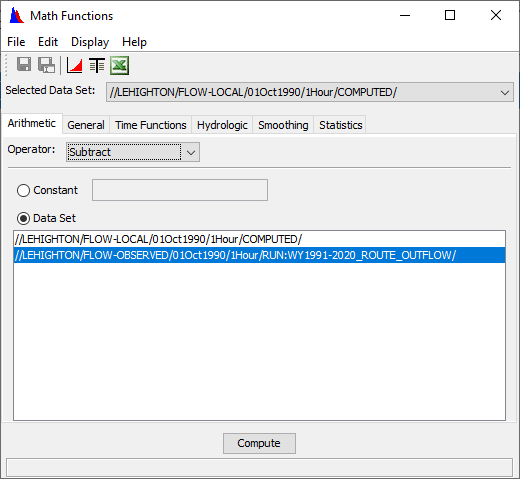
- Click the Compute button. Check that "Compute Complete" appears on the bottom of the Math Functions window and then close the window. Click the Yes button to save changes.
- Select the F5 button to refresh the catalog and click the Clear Selections button.
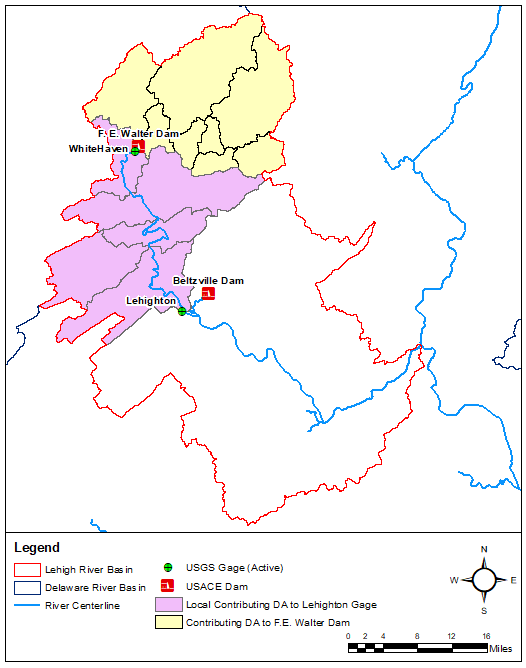
- The following figures illustrate the local flow computation. Local flow is defined as the sum of outflows from all elements between the current junction and the junction upstream. Therefore, the local drainage area (DA) at the Lehighton gage is equal to the difference between the DA at Lehighton and the DA at F.E. Walter Dam. Discharge at the Lehighton gage is the equivalent to the summation of the runoff from the DA to F.E. Walter Dam (yellow region) routed to the Lehigh gage and the local DA of the gage (purple region). The local discharge at Lehighton is computed as the difference between the observed discharge at the Lehighton gage (flow from the yellow and purple regions) and the routed discharge from F.E. Walter Dam (flow from the yellow region routed to Lehighton).
- Hydrographs corresponding to observed flow at Lehighton, outflow from F.E. Walter Dam, and routed outflow from F.E. Walter Dam at Lehighton are shown in the figure below. The gray region corresponds to the portion of the hydrograph that is local flow.
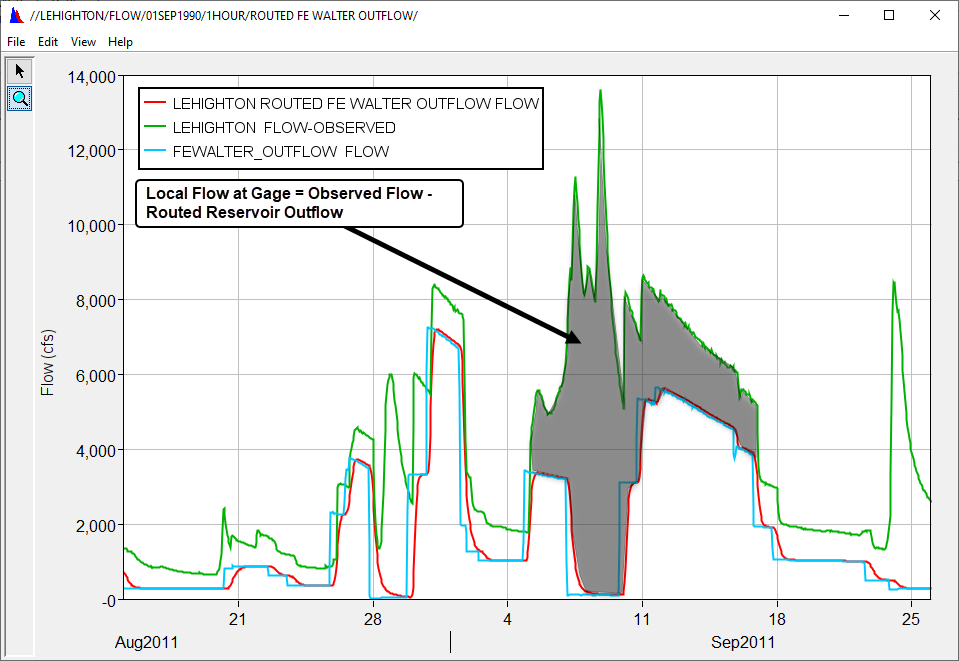
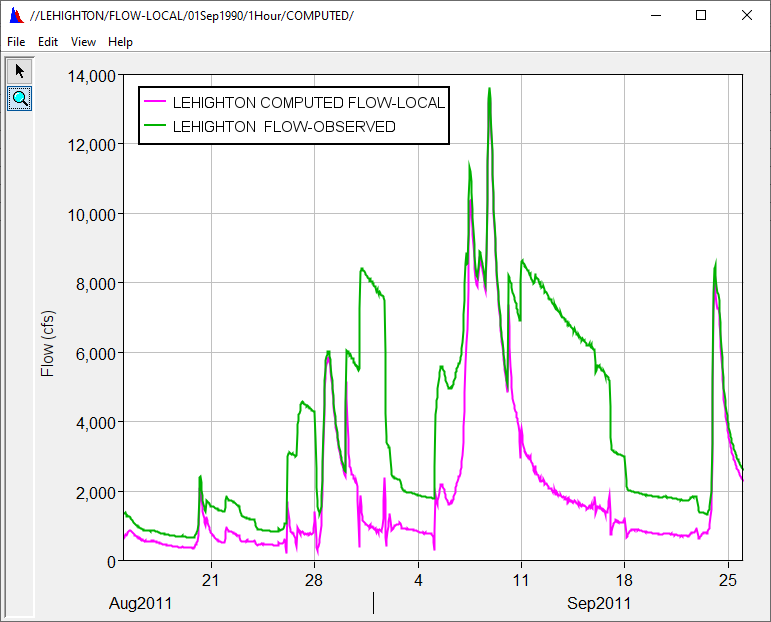
- The observed and local hydrographs at Lehighton are shown in the figure below. Notice that local flow comprises the majority of the hydrograph during the high flow portion of the hydrograph. F.E. Walter Dam is operated for flood control. During high flow events, minimal streamflow releases are made from the dam. Thus, runoff from the intervening drainage area between the dam and the gage comprises the majority of the gage hydrograph.
- Right click the FLOW-LOCAL record and select Duplicate. Change the C-part to FLOW-UNREG and the F-part to COMPUTED_IO. Click the OK button.
- Select the following records:
- //LEHIGHTON/FLOW-UNREG/30Sep1990 - 30Sep2020/1Hour/COMPUTED/
- //LEHIGHTON/FLOW/30Sep1990 - 30Sep2020/1Hour/RUN:WY1991-2020_ROUTE_INFLOW/
- Select Tools | Math Functions from the top ribbon.
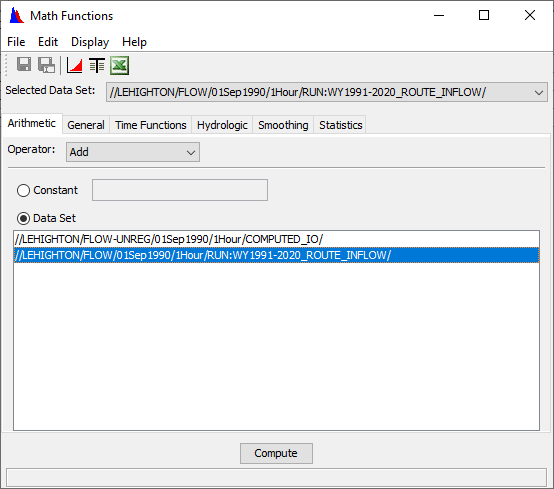
- On the Arithmetic tab, select the FLOW-UNREG record in the Selected Data Set drop down menu.
- Select Add from the Operator drop-down menu.
- Select the Data Set radio button and the FLOW record in the selection box.
- The Math Functions tab should look like the figure below. This selection will perform the following computation: Unregulated\,Flow\,at\,Gage = Local\,Flow + Routed\,Reservoir\,Inflow
- Click the Compute button. Check that "Compute Complete" appears on the bottom of the Math Functions window and then close the window. Click the Yes button to save changes.
- Select the F5 button to refresh the catalog.
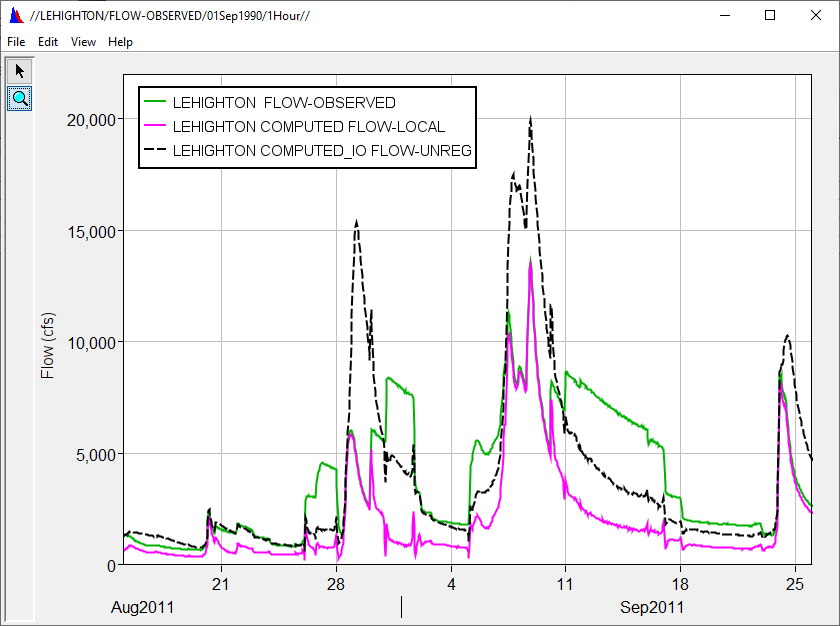
- Plot the FLOW-LOCAL, FLOW-OBSERVED, and FLOW-UNREG time series by selecting the three records and select the plot button
 from the top ribbon.
 - Change the time window to the August - September 2011 event using the Set Time Window button. The plot should look similar to the figure below. Notice that the FLOW-UNREG hydrograph has a higher peak than the FLOW-REG hydrograph, as is expected.
Continue to Hydrologic Routing of Reservoir Holdouts.
If you are completing this tutorial as part of the Flood Frequency Analysis PROSPECT course, you are done!
Project Files
Download the final files at the bottom of the Comparison of Results page.