Download PDF
Download page Task 2: Extracting time-series data from grids.
Task 2: Extracting time-series data from grids
Return to Task 1: Importing Gridded Data
Last Modified: 2025-01-28 16:18:30.289
HEC-HMS version 4.13-beta.4 was used to create this example. You can open the example project with HEC-HMS v4.13-beta.4 or a newer version.
Project Files
This task is a continuation of the Downloading, Importing, and Processing Gridded Data tutorial. You can proceed with project files from Task 1: Importing Gridded Data or download new project files here:

Introduction
In this workshop you will use the HEC-HMS Grid-to-Point utility to convert gridded time-series records to a point time-series, where each point in the time-series represents a zonal average of the gridded data over a spatial domain.
Convert MRMS precipitation data to a time-series
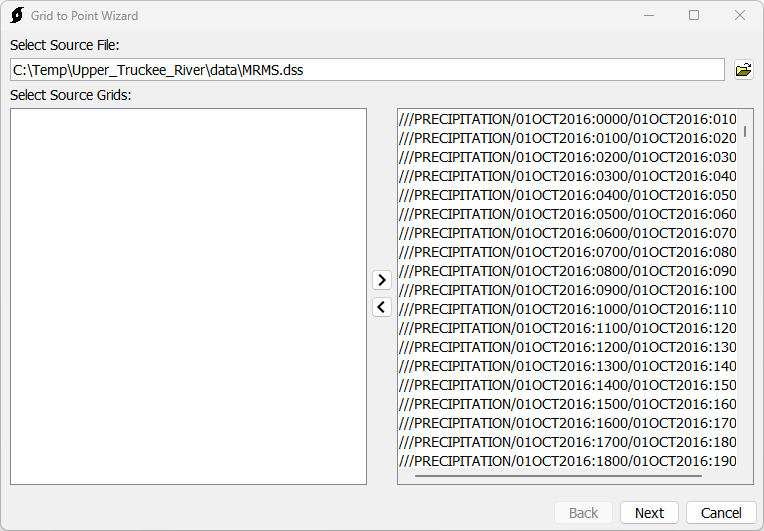
In HEC-HMS, from Tools | Data | Grid-to-Point, launch the Grid-to-Point Wizard.
In the first step of the wizard select the <path to>/Upper_Truckee_River/data/MRMS.dss file. Select all gridded records.
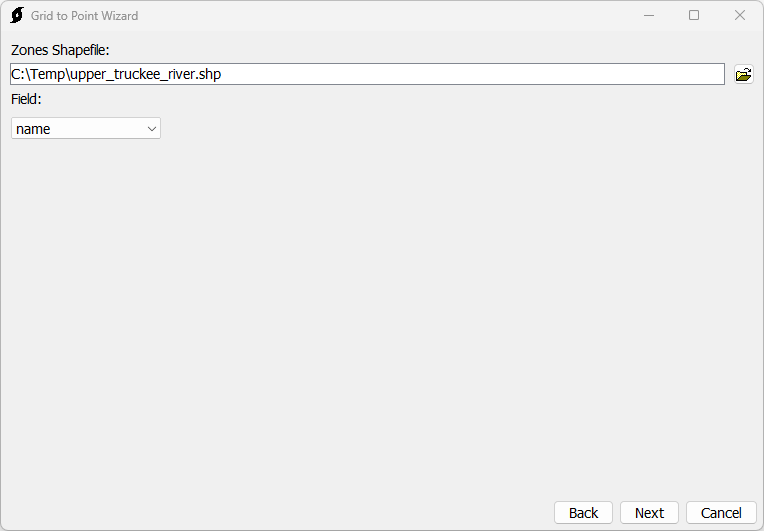
In the second step of the wizard, specify zonal statistics parameters:
- The Zones shapefile defines the geometries for which the zonal statistics will be calculated. Select the shapefile that was created in Export a clipping shapefile.
- The Field is the basis for the HEC-DSS pathname B-part for the HEC-DSS record that will be created. Select the name field.
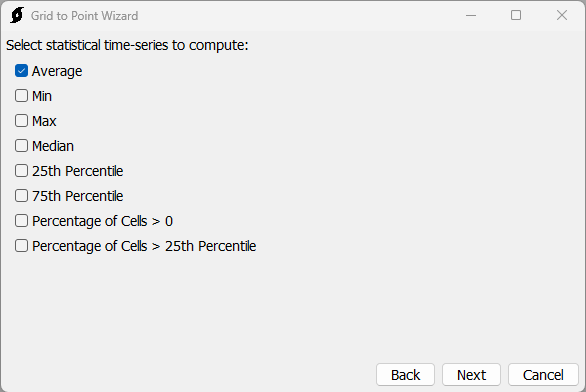
On the third step of the wizard, select Average.
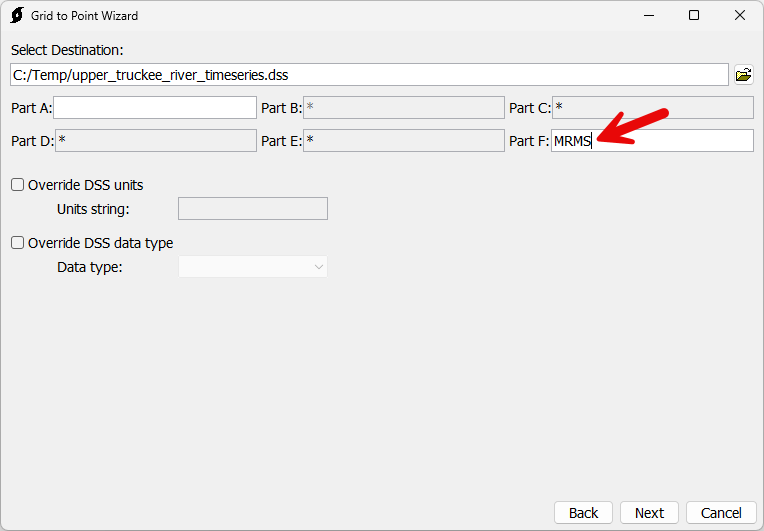
On the fourth step of the wizard, write the time-series to a file named upper_truckee_river_timeseries.dss.
Set the F-part for the written record to "MRMS".
Click Next to proceed with the zonal statistics calculation.
Convert PRISM precipitation data to a time-series
In HEC-HMS, from Tools | Data | Grid-to-Point, launch the Grid-to-Point Wizard.
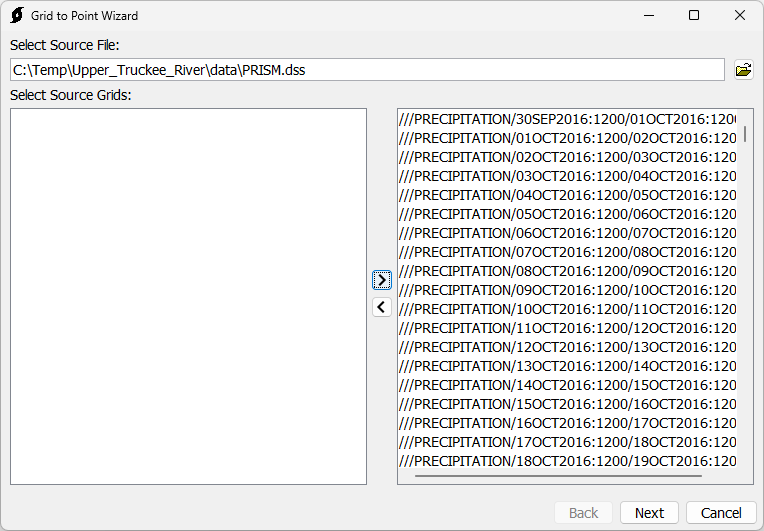
In the first step of the wizard select the <path to>/Upper_Truckee_River/data/PRISM.dss file. Select gridded records from 01OCT2016:1200 to 01OCT2017:1200 (matching the period chosen for MRMS dataset).
In the second step of the wizard, specify zonal statistics parameters:
- The Zones shapefile defines the geometries for which the zonal statistics will be calculated. Select the shapefile that was created in Export a clipping shapefile.
- The Field is the basis for the HEC-DSS pathname B-part for the HEC-DSS record that will be created. Select the name field.
On the third step of the wizard, once again, select Average as the statistical time-series to compute.
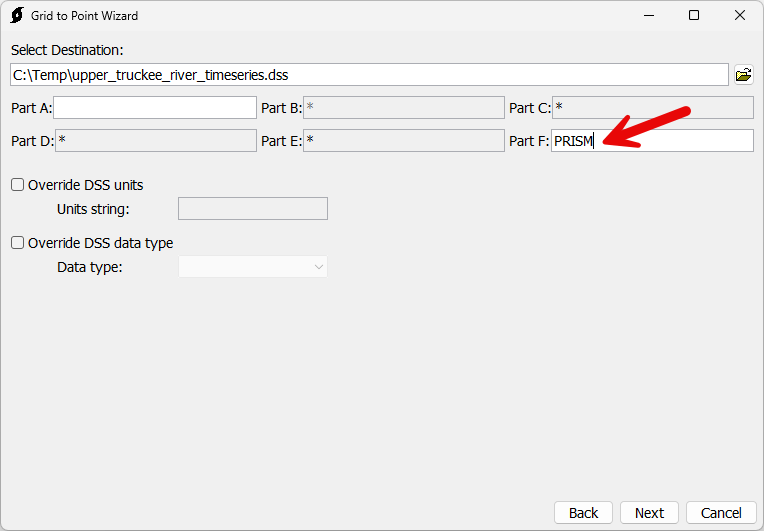
On the fourth step of the wizard, write the time-series to a file named upper_truckee_river_timeseries.dss.
If prompted to overwrite, select "Yes". You will not be overwriting the HEC-DSS file, but appending it.
Set the F-part for the written record to "PRISM".
Click Next to proceed with the zonal statistics calculation.
Compare MRMS and PRISM accumulations
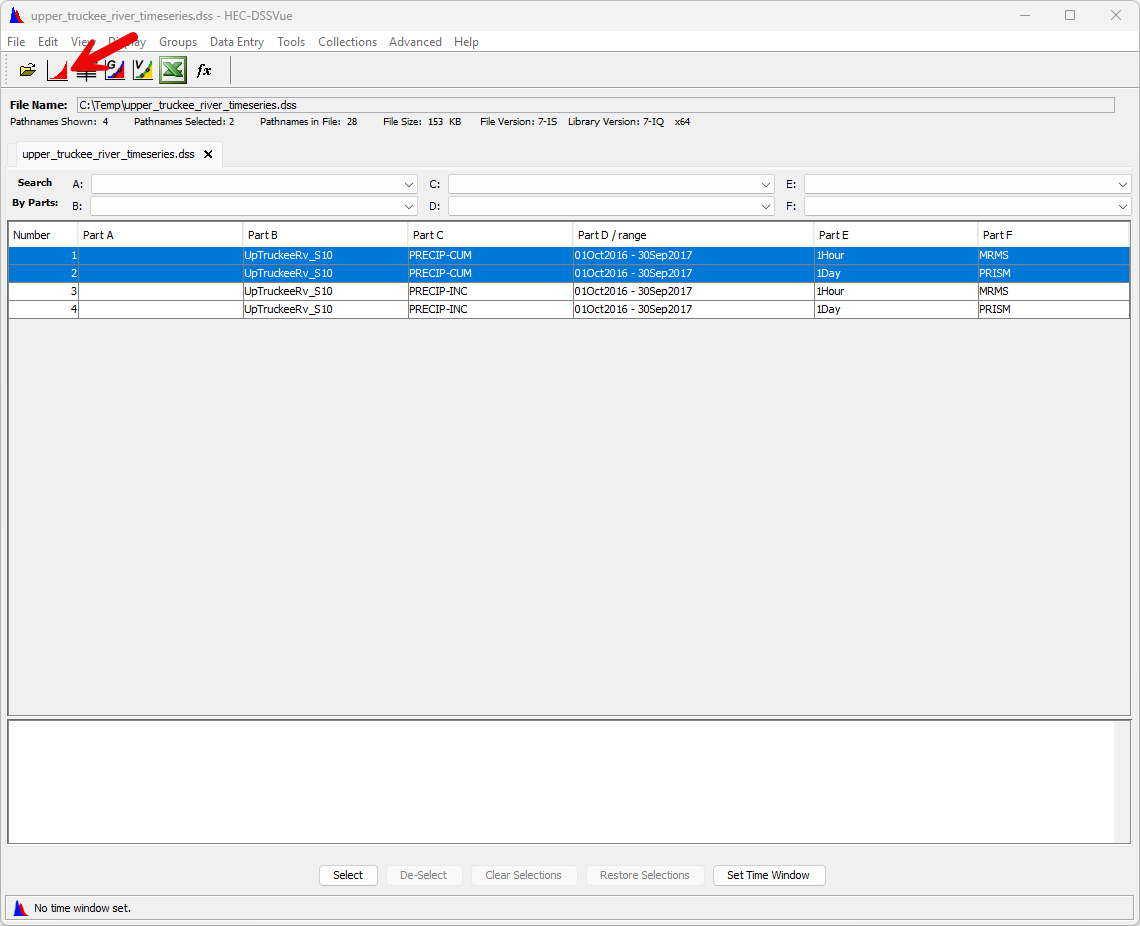
Open the upper_truckee_river_timeseries.dss file in HEC-DSSVue.
Select the two PRECIP-CUM time-series records. Click the Plot button to plot the two time-series.
Observe the discrepancy and accumulated precipitation over WY 2017.
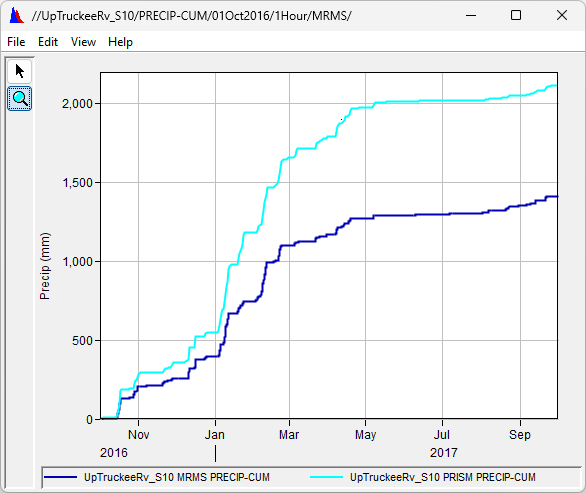
Over the course of WY 2017, the accumulation of precipitation over the UpTruckeeRv_S10 subbasin is 1,410 mm (55.5 in) for the MRMS dataset compared to 2,112 mm (83.1 in) for the PRISM dataset. The MRMS precipitation yields approximately 2/3rds of the PRISM precipitation.
Summary
In this tutorial:
- Cumulative precipitation time-series were extracted from gridded data for MRMS and PRISM datasets,
- and cumulative precipitation time-series were compared for MRMS and PRISM datasets.
The task is part of the Downloading, Importing, and Processing Gridded Data tutorial. You can continue to Task 3: Normalizing Precipitation Data with existing project files. You can download the final project files for this task here:
Proceed to Task 3: Normalizing Precipitation Data