Download PDF
Download page v.4.15.0 Release Notes.
v.4.15.0 Release Notes
Initial Beta Release:
Final Version Release:
New Features
Modified Kling-Gupta Efficiency (MKGE) added to Statistics Report
The Modified Kling-Gupta Efficiency (MKGE) calibration statistic was added to HEC-HMS in v4.13. However, the statistic was not added to the Statistics Report until version v4.15-beta.1. The report now shows the observed flow MKGE value for every Computation Point.

Qualitative performance ratings for MKGE values are intentionally not provided because Nash-0Sutcliffe Efficiency (NSE) and MKGE values cannot be directly compared and the relationship depends in part on the coefficient of variation of the observed time series (Knoben et al., 2019).
This feature was funded by the FEMA Future of Flood Risk Data initiative. Initial code implementation and documentation were completed by Avital Breverman. Testing and code review were completed by Josh Willis and Nick Van.
Extend the Reset button to additional parameters in the Combined Parameter Editor
The Reset button clears all adjustments in the table. It was previously available only to the Initial Baseflow and Reservoirs tabs. The button has been added to the remaining tabs in the editor.
This feature was funded by the USACE CWMS National Implementation Program. Initial code implementation and documentation were completed by Daniel Black. Testing and code review were completed by Alex Davis and Nick Van.
Add new spinner boxes to the Uncertainty Analysis and Optimization Trials
Users can now add and remove Uncertainty Analysis and Optimization Trial Parameters with a spinner box.

This feature was funded by the Hypothetical Storms Research and Development Work Unit. Initial code implementation and documentation were completed by Daniel Black. Testing was completed by Lauren Coe and Nick Van.
Add new "observed" frequency curve data type
Two new paired data types were added to HEC-HMS: 1) Flow-Frequency Curve and 2) Stage-Frequency Curve. The Data Source for these frequency curve types can be either manual entry or HEC-DSS. When added as an "Observed Frequency Curve" to a Frequency Analysis compute type, the result plot will contain both the computed frequency curve and the observed frequency curve for comparison.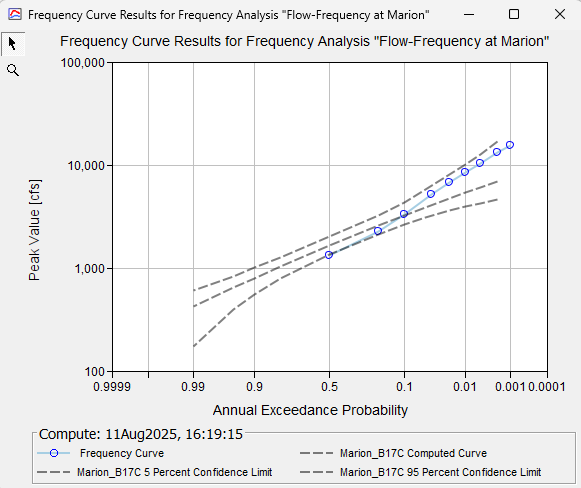

Available Tutorial and Guide
A tutorial and guide demonstrating the Frequency Analysis and the new Flow-Frequency Curve paired data type can be found here: https://www.hec.usace.army.mil/confluence/hmsdocs/hmsguides/meteorologic-methods-in-hms/flow-frequency-simulation-options-in-hec-hms/applying-the-frequency-analysis-compute-type
This feature was funded by the USACE Flood & Coastal R&D Hypothetical Storms work unit. Initial code implementation and documentation was done by Josh Willis. Testing was done by Tom Brauer, Greg Karlovits, and Nick Van.
Customize Table Columns
New customization added to global editor tables to allow users greater flexibility in table display. These are program-level settings, so the same column customization settings will apply to all projects for a given table. The settings are also version-specific, so future versions of HMS can import the settings or they can be reset. These settings are available in the following tables: basin and reach characteristics, basin model global parameters, meteorologic model global parameters, and forecast parameter tables.
- Horizontal scroll bar. A horizontal scroll bar will display automatically if the number of columns is too wide for the display window, rather than reduce the column width.
- Persist column order. Drag-and-drop columns to change the column order, and column order is now saved and will persist between HMS sessions and projects.
- Hide columns. Right-click a column to hide the column from the display.
- Column visibility settings dialog. New "View" dialog added to applicable global editor tables that can control column order and column visibility to view or hide columns.
This feature was funded by the USACE CWMS National Implementation Program. Initial code implementation and documentation were completed by Melissa Mika. Testing and code review were completed by Jay Pak, Tom Brauer, and Paul Ely.


Storm Pattern Extractor
Storm Pattern Extractor — A new wizard tool under Tools | Precipitation | Storm Pattern Extractor automates the development of custom temporal patterns for the Hypothetical Storm meteorologic method from an incremental precipitation time‑series gage. Storms are filtered by depth and duration or by annual maximum and duration, reviewed and edited as percent‑time versus percent‑depth curves, and exported to HEC‑DSS and to the project as Percent Graph paired data tables. The exported curves can be applied one at a time in a deterministic Hypothetical Storm, sampled as an uncertainty variable, or aggregated into watershed‑specific percentile patterns similar to NOAA Atlas 14's regional temporal patterns.
This feature was funded by the Hypothetical Storms Research and Development work unit. Initial code implementation and documentation were completed by David Ho; code review was completed by Melissa Mika and Nick Van.

A tutorial and guide demonstrating the Storm Pattern Extractor can be viewed here: https://www.hec.usace.army.mil/confluence/hmsdocs/hmsguides/meteorologic-methods-in-hms/flow-frequency-simulation-options-in-hec-hms/extracting-storm-temporal-patterns-using-the-storm-pattern-extractor
Cross-Validation Compute Type
A new compute type is available in HEC-HMS. Cross-validation allows the user to see how a given set of calibrated parameters perform over different validation periods with different initial watershed conditions. This helps to inform which parameter values are best suited to represent the watershed under diverse conditions. An automated cross-validation process within HMS streamlines this workflow and helps the user more efficiently select parameters and highlight potential outliers. Cross-validation automatically swaps pre-determined initial conditions from Simulation Runs which are treated as Cross-Validation Members. Users can then compare performance metrics of each calibrated parameter set when applied to different basin conditions.


A tutorial and guide demonstrating performing a Cross-Validation Analysis can be viewed here: Performing a Cross-Validation Analysis
Bugs Fixed
Standard Report does not plot element time series plots
Element time series plots in the Standard Report could come out empty or begin at the wrong time. The simulation start/end window passed to the DSS reader was being converted through the computer's local time zone, but HMS stores result times as wall clock time. That conversion shifted the window by the local UTC offset, so it no longer overlapped the stored records. The read window is now taken directly from the simulation start and end times, matching the time basis the results were computed on. This issue was introduced in v4.14 and fixed in v4.15-beta.1.
Statistics Report does not properly render color-coded qualitative rating for Moriasi calibration statistics
Calibration statistics documented by Moriasi et al. (2015) and (2007) (RMSE standard deviation, Nash Sutcliffe Efficiency, Percent Bias, and Coefficient of Determination) was written to the Statistics Report as visible code, such as <button style="background-color:#3C8A3B">0.95</button>, instead of a color-shaded value. The colors returned to the report and now match the shading its stylesheet defines. This issue was introduced in v4.14 and fixed in v4.15-beta.1.
Refresh default name when creating new paired data tables
Changing the Data Type when creating a new paired data table now correctly refreshes the default name. This issue was introduced in v4.12 and fixed in v4.15-beta.1.
Update Spatial Results Color Scales with the Basin Model Unit System
Some spatial results color scales, namely precipitation depths, use unit-system-specific color scales (e.g., pink means a certain value while blue means a different value). In previous versions, these corresponding values (and thus colors) did not change even when the basin model's unit system changed. This has been rectified such that color scales are now unit-system-aware. This issue was introduced in v4.7 and fixed in v4.15-beta.1.
Fix mismatched grid/gage import
When importing a meteorologic model, time series gages were mistakenly read from the .grid file and imported grids were not correctly renamed. This has been rectified such that the correct files are read for both time series gages and grid sets when importing a meteorologic model. This issue was introduced in v4.12 and fixed in v4.15-beta.1.
Prevent Memory Leak and Ensure Calibration Aid Menu Item is Correctly Enabled
In previous versions, when selecting a 2D Connection, a BasinManager was opened and never closed. Additionally, the Calibration Aids menu item was not correctly enabled/disabled. Now, the BasinManager is correctly closed and the Calibration Aids menu item is correctly updated. This issue was introduced in v4.7 and fixed in v4.15-beta.1.
Frequency curve results plot does not follow display themes
Fixed an issue where frequency curve results plots did not follow the dark display theme. Plot backgrounds, titles, axis labels, tick labels, and curve markers now use theme-appropriate colors, improving readability and consistency with other results plots. This issue was introduced in v4.11 and fixed in v4.15-beta.1.
Restrict ensemble member results to the compute window
Fixed an issue where ensemble member results could contain values outside of the current compute window. This could occur if the window was initially computed at a larger time-window and then shortened by the user. This issue was introduced in v4.11 and fixed in v4.15-beta.1.
Opening ensemble statistics results fail while an ensemble plot is open
Fixed an issue where tabular ensemble statistics results failed to open if an ensemble plot was already open. Now, multiple ensemble results can be viewed simulataneously. This issue was introduced in v4.11 and fixed in v4.15-beta.1.
Right-clicking basin element in map pane is irresponsive
Right-clicking a basin element while an Ensemble Analysis was selected prevented the element context menu from appearing due to a NullPointerException. The toolbar attempted to access spatial results, which ensembles do not provide. Now, the element context menu appears as expected after right-clicking an element. This issue was introduced in v4.11 and fixed in v4.15-beta.1.
Notify Users of Undefined Unit Systems When Importing a 2D Mesh
When a malformed 2D mesh was imported with an undefined unit system in previous versions, values were inferred as metric and the mesh could have been silently rescaled. Now, unrecognized, blank, or unreadable unit systems fail loudly with error messages naming the value and the file making the failure visible instead of silent. This issue was introduced in v4.7 and fixed in v4.15-beta.1.
Specified grid values not saved with file-specified discretization
When a subbasin used File-Specified discretization, parameter values entered using the Specified Values option for gridded loss methods were not saved. Closing and reopening the editor cleared the entered values. Specified grid values are now saved in the basin model’s GIS file, including when no coordinate system is assigned. This issue was introduced in v4.13 and fixed in v4.15-beta.1.
Read-only table cells look editable
Read-only table cells were not shaded in the light and dark display themes, making them appear editable. These cells are now shaded to distinguish them from cells that accept input. Selection highlighting is also preserved for read-only cells when a row is selected. This issue was introduced in v4.11 and fixed in v4.15-beta.1.
Kinematic Wave global editor does not write Plane2 entries to disk
Values entered into Kinematic Wave global editor for Plane 2 did not save to file, and were lost when the project was open again. This issue was introduced in v4.10 and fixed in v4.15-beta.1.
Correct plot axis bounds for empty and negative data
Plots with empty or undefined data could receive invalid axis bounds, and plots containing only negative values could show an incorrect upper bound. Plot axes now keep their existing bounds when no valid values are available and scale correctly for negative values. This issue was introduced in v4.14 and fixed in v4.15-beta.1.