Note: The stylesheet reports that were available in previous versions are no longer supported. To access these reporting options see Stylesheet Reports below.
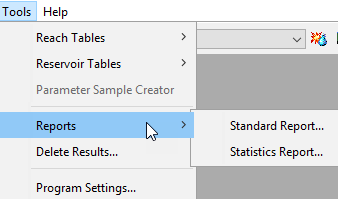
Standard and Statistics report options are available from the Tools | Reports . The Standard report summarizes information in the basin model, including simulation results and element parameters, Time series results can also be selected for basin model elements as well. The Statistics report will summarize metrics for the selected simulation run at each location with observed discharge.
Standard Report
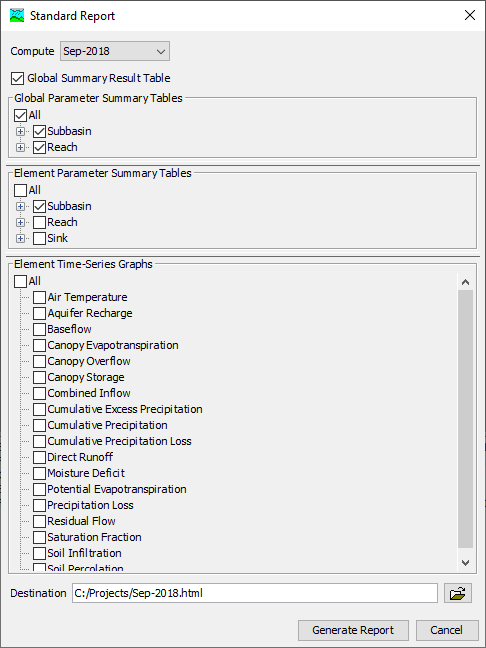
The Standard Report option creates an HTML report with options to include global parameter summary tables, a global results summary table, element parameter summary tables and result graphs for each basin element. Content can be customized using check box selections in the user interface as shown below. The report is written in HTML format and can be rendered in a web browser.
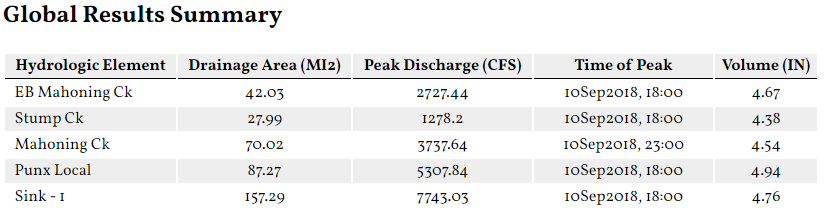
global summary results table shows summary results for each element. The image below shows an example global summary results table.
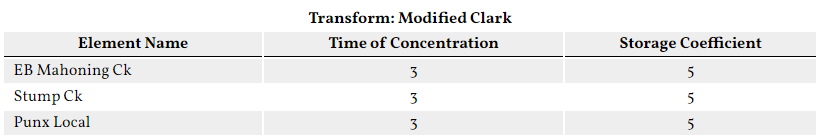
Global parameter summary tables show, for a given method, parameters for each element. The image below shows the global parameter summary table for subbasins using the Mod Clark transform method.
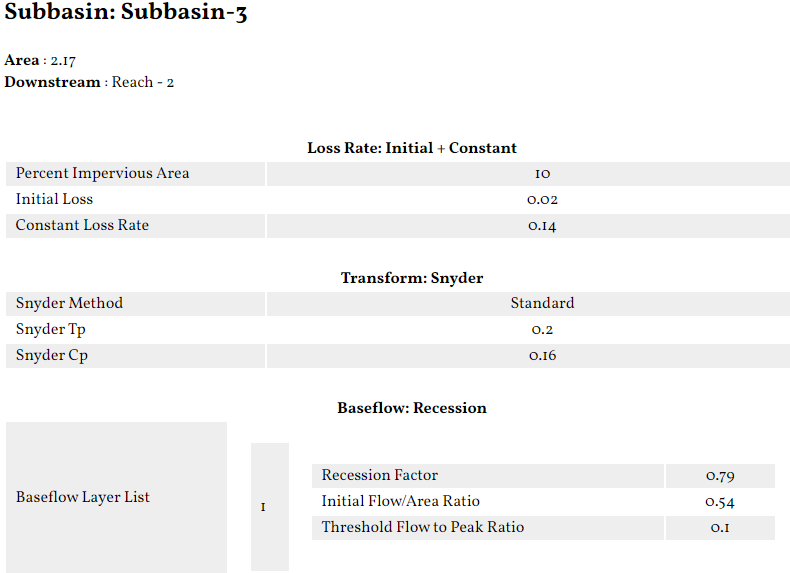
Element parameter summary tables show, for a given element, all parameters defined for the methods chosen to simulate hydrologic processes. The image below shows an example subbasin element parameter summary table.
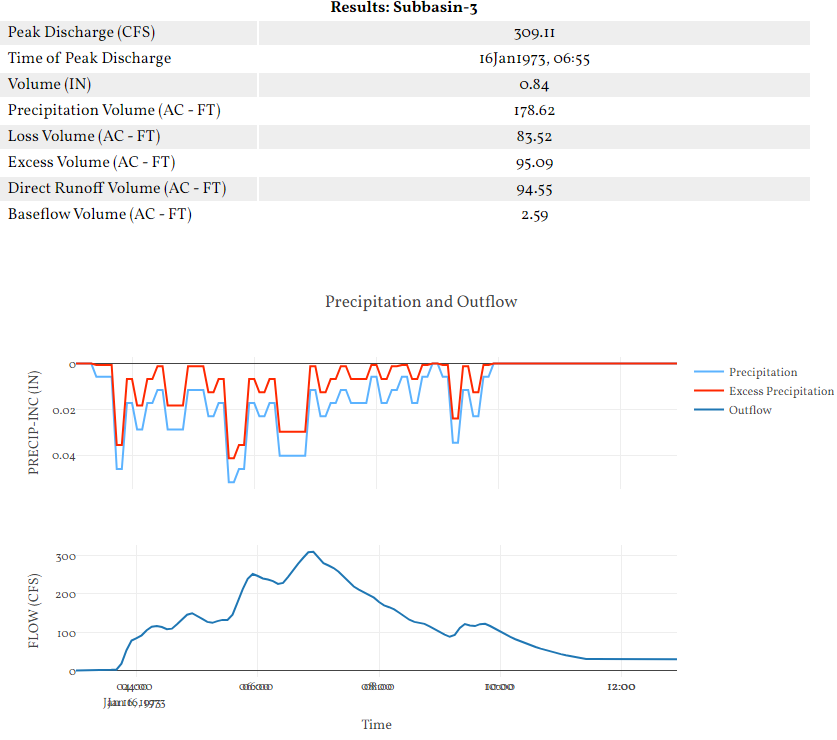
Element summary results, shown below, are also created by default for any element with summary information.
Additional time-series graphs can be added to the report by selecting variables in the Element Time-Series Graphs section of the Standard Report dialog.
Statistics Report
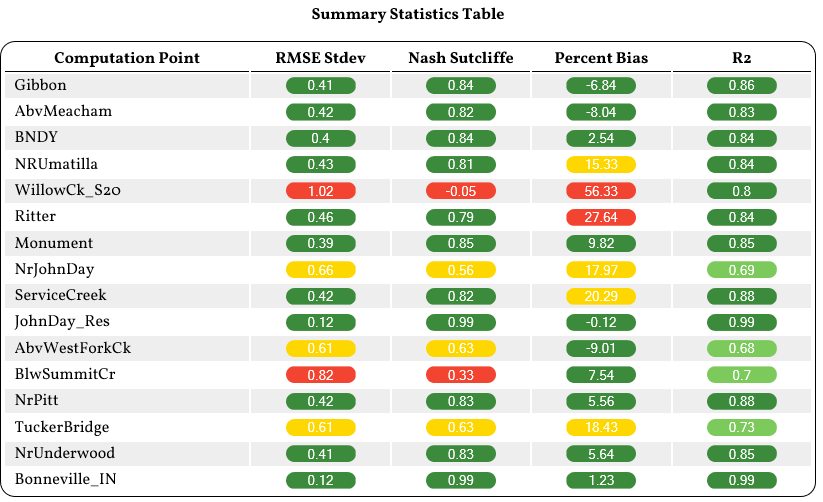
The Statistics Report option creates an HTML report with summary statistics for all observed flow locations in a simulation. Summary statistics included in the report are: Coefficient of Determination (R2), Nash Sutcliffe Efficiency (NSE), Root Mean Squared Error Ratio (RSR), and Percent Bias (PBIAS). The default color codes for each statistic are presented . The Statistics Report is written in HTML format and can be rendered in a web browser.
Color Code | R2 | NSE | RSR | PBIAS |
Dark Green | 0.65<R2≤1.00 | 0.65<𝑁𝑆𝐸≤1.00 | 0.00<𝑅𝑆𝑅≤0.60 | 𝑃𝐵𝐼𝐴𝑆< ±15 |
Light Green | 0.55<𝑅2≤0.65 | 0.55<𝑁𝑆𝐸≤0.65 | 0.60<𝑅𝑆𝑅≤0.70 | ±15≤𝑃𝐵𝐼𝐴𝑆<±20 |
Orange | 0.40<𝑅2≤0.55 | 0.40<𝑁𝑆𝐸≤0.55 | 0.70<𝑅𝑆𝑅≤0.80 | ±20≤𝑃𝐵𝐼𝐴𝑆<±30 |
Red | 𝑅2≤0.40 | 𝑁𝑆𝐸≤0.40 | 𝑅𝑆𝑅>0.80 | 𝑃𝐵𝐼𝐴𝑆≥±30 |
Stylesheet Reports
Stylesheet report options were released in v.2.2.1, https://www.hec.usace.army.mil/software/hec-hms/documentation/HEC-HMS_Stylesheet_Reports_Guide.pdf. The stylesheet options have been removed from the user interface in v.4.6 in lieu of new HTML reporting options. The legacy stylesheet options can be accessed when running the program in debug mode (see Running the Program).