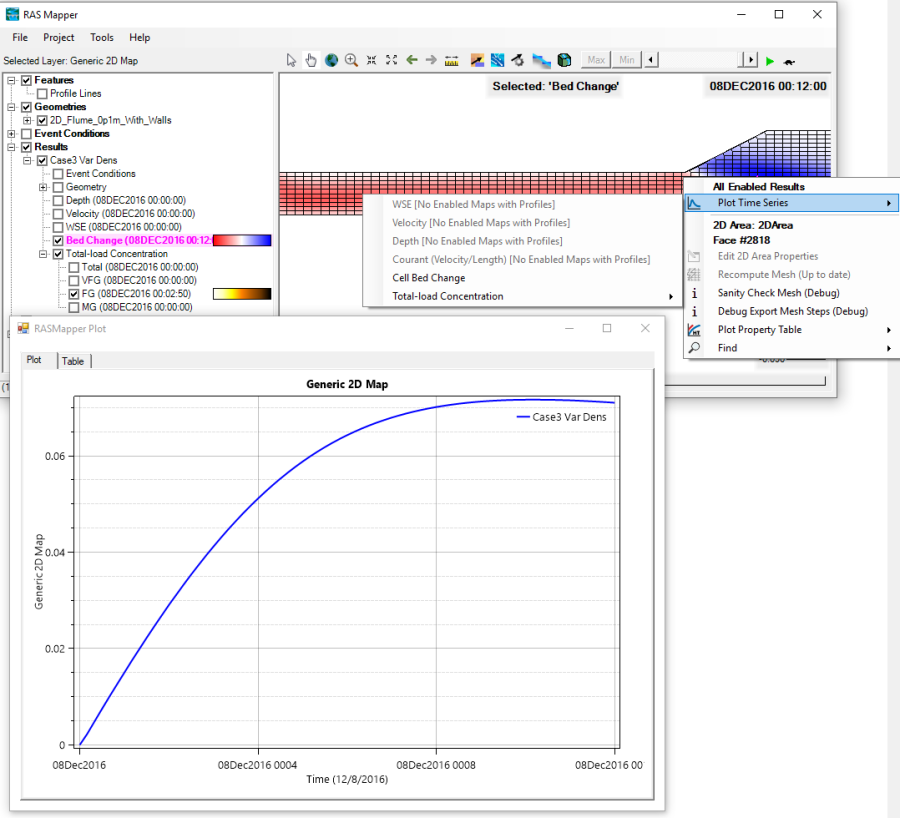
Right click on a cell or cell face to visualize sediment time series within the model domain. Right clicking on a model cell or face generates the vidualization menu depeicted in the figure below. Select Plot Time Series . The Plot Time Series option expands into a sub-menu with that includes all of the Results maps (default and added) included in the active plan(s). Only the Results Maps selected (checked) in RASMapper are avialble, however. In the example below, WSE, Velocity, Depth, and Courant are not selected (checked) in RASMapper, so they are greyed out. But bot Bed Change and Total-Load Concentration are checked, so they are availbe. The example below slected Cell Bed Change, requesting the depicted time series at this cell.
If sediment results have multiple grain classes, (e.g. Total-load Concentration below) these variables have additional sub-menus where users can choose if they want to plot the Total result or the result from individual grain classes. Again, only the sub-class results selected in the main RASMapper pane will be available. Figure 2 51. View a time series of a sediment (or hydraulic) result by selecting (chekcing) it in the RASMapper result tree and then right clicking on the cell. Select Plot Time Series and then the result map to launch the time series for that cell or cell face.