Download PDF
Download page Dynamic Mapping.
Dynamic Mapping
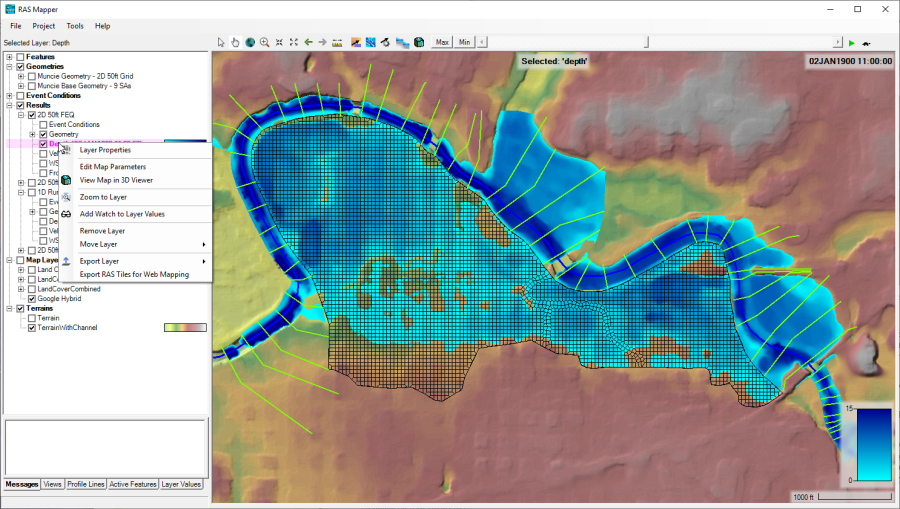
As shown in Figure 6-7, there will be results layers for each Plan that has been run. For this example, under the Results layer in the panel on the left side, there are results for a Plan called "2D 50 ft Grid". Under the "2D 50 ft Grid" layer there are five sub layers: Event Conditions, Geometry, Depth, Velocity, and WSE (water surface elevation). The Event Conditions layer will contain any spatial meteorological data that has been set up for the boundary conditions file attached to that plan (ex. Precipitation data). The Geometry Layer represents the geometry data used in the plan and written to the output file. The other layers (Depth, Velocity, and WSE) are Dynamic Mapping output layers. Each layer name is followed by a set of parentheses. The information following in the parentheses describes what current grid is showing in the plot. Inside the parentheses could be a specific date and time, or max, or min.
Right clicking on any of the results layers (for example Depth) will show a context sensitive menu that has several options for this output layer. These options are: Layer Properties; Edit Map Parameters; View Map in 3D Viewer; Zoom to Layer; Add Watch to Layer Values; Remove Layer; Move Layer; Export RAS Tiles for Web Mapping (Figure 6-7) and Show Summary Statistics. 
Layer Properties – This option allows the user to control what each layer looks like, such as colors, color ramps, symbol and line colors and types, fill styles, etc… It also contains a tab called "Source" which provides information about the layer, as well as what the file name is, where it is stored, etc…
Edit Map Parameters – This option allows the user to edit or change the parameters of the map layer.
View Map in 3D Viewer – this options opens the currently selected result into the 3D Viewer.
Zoom To Layer – This option zooms in or out, such that the extents of the selected layer are visible.
Add Watch to Layer Values – This option allows the user to add variables to a "Watch" list. When turned on, the variables will show up next to the mouse pointer and also in a table at the bottom left, when the "Layer Values" tab is selected. As you move the mouse over top of the wet area on the map, the magnitude of the watch variables is displayed dynamically.
Remove Layer – This option allows the user to delete the layer from the RAS Mapper window.
Move Layer – This option allows the user to move the layer up or down within the RAS Mapper layer list. This is important, since something that is higher in the list (above) will be plotted on top of things that are lower in the list (below), when multiple layers are turned on together for display. When this option is selected, several sub menus will popup that allow the user to move a layer: Top; Up One; Down One; Bottom. The user can also left-click on a layer and drag it up and down within the layers list.
Export Layer – This option allows the user to export the layer as a Raster (*.tif) to a file.
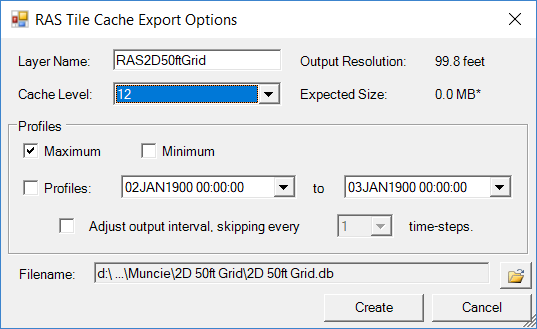
Export RAS Tiles for Web Mapping– This option will export the Depth grid to what is termed a Tile Cache (before doing this the user must set the spatial projection using the Set Projection for Project option from the RAS Mapper Tools menu). A Tile Cache is a series of files (256 x 256 pixels) with different resolutions, written out using a pyramided and tiled scheme that meets Google's mapping specifications (i.e., there will be several directories, each one representing a different resolution). When this option is selected, the window shown in Figure 6-8 will appear.
The user is required to set the Filename and Folder in which these subfolders will be developed and the tiles will be stored. Additionally the user should select the Cache Level that will represent the most detailed tile level (when zoomed in). If the user plans on zooming way in for greater detail in the map, a higher Cache level (smaller cell (pixel) size) should be selected. However, the higher the cache level selected, the longer it will take to generate this Tile Cache, and the larger the file storage space required. Also, this cell (pixel) size will change depending on the latitude of the project.
Show Summary Statistics – When this option is selected for a specific layer (ex. Water Surface Elevation), the software will compute the following summary statistics for that layer based on the currently displayed time step: Mean; Standard Deviation; Minimum; and Maximum.
Animating Map Layers
Any Map Layer that is "Dynamic" can be animated in time. The animation control can be used to animate a single map layer; multiple map layers within the same Plan; or multiple map layers from different plans.
To animate a single map layer, turn that map layer on, then make it the active map layer (Layer will be highlighted in a Magenta color). Once a layer is turned on, and made the active layer, then the animation control at the top of the map window, can be used to animate that layer in time. The animation control has a play button, as well as Max, and Min options.
To animate multiple map layers within the same Plan, turn on all of the desired map layers within the Plan, then select the Plan identifier to make it the Active plan (It should be highlighted in Magenta). Then use the animation control to animate all of that plans layers in time together.
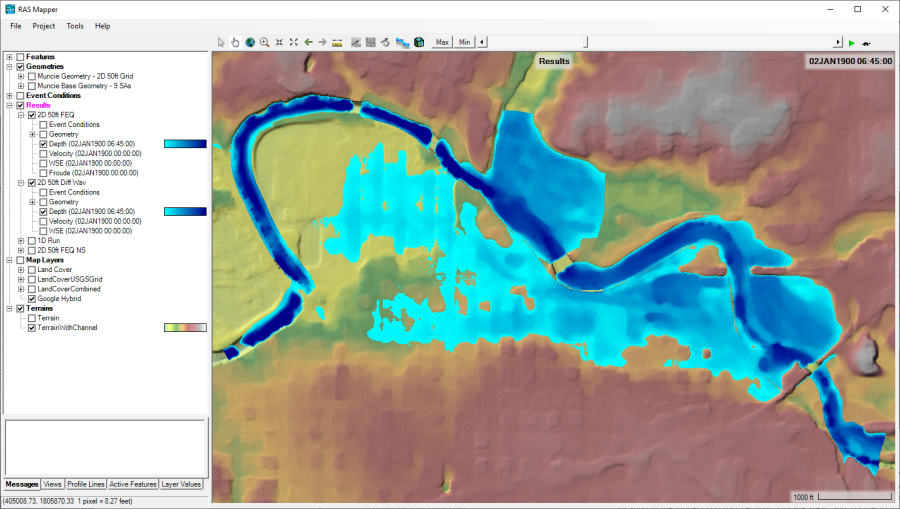
To animate multiple map layers from different plans, turn on all the desired map layers to be animated from separate plans. Next, select the results layer to activate all of the results for animation (The Results layer will be highlighted in Magenta). Then use the animation control to animate all of the turned on map layers in time. An example of animating two different Depth layers, from different plans, is shown in Figure 6-9. As long as both plans have output for the same date and time, they will be shown. The software uses the highest layer in the tree for deciding on the time window, and time steps available for animation. If any of the other map layers that are turned on do not have an output at that specific point in time, then it is simply not shown, and the layer will have a label called "No Data" for the date and time portion of the label.
As shown in Figure 6-9, when animating the Depth layer for a specific Plan(s), the user will have the option of selecting: Max, Min, or using the slider bar to move to a specific point in time during the event. If Max is selected, then the maximum inundation that occurred at every location in the model (1D cross sections, storage areas, and 2D mesh) will be plotted for the depth grid. If Min is selected, then the minimum depth that occurred at every location within the event will be displayed. If the user selects the Play button (far right green arrow), then the map(s) will automatically plot each mapping output interval in sequence (i.e. animate). The animation can be stopped by selecting the Pause button. If the user uses the slider bar, they can select a specific date and time, which will result in showing the inundation map for that specific instance in time. The times available are based on the Mapping Output Interval specified in the Unsteady-Flow Simulation window. The user can also hold down the right arrow or left arrow at the ends of the slider bar to have it animate the map, either forwards or backwards in time. Keep in mind these maps are being created on-the-fly in memory. They do not exist in a file on the disk. Because these maps are being created on-the-fly, this is referred to as Dynamic Mapping (Try it out, it's fun!!!). It is also the best way to visualize the results of the model from a mapping perspective.
To create a movie file, one option is to use commercial software, such as Snagit® software (or similar screen capture utility package) to capture the screen while animating the inundation results. Another Option for capturing video is to use the built in video capture tools that are part of Microsoft office. This is available from the PowerPoint software application.