Download PDF
Download page Map Rendering Modes.
Map Rendering Modes
There can be important differences in the computed values between the dynamic results and the stored raster information. Dynamic maps differ in that they are a surface created through the interpolation of values; therefore, as the user moves the mouse in the display the interpolated value for the corresponding location will be displayed. This is in contrast to viewing a raster in a typical GIS where the reported value will be that for the entire grid cell.
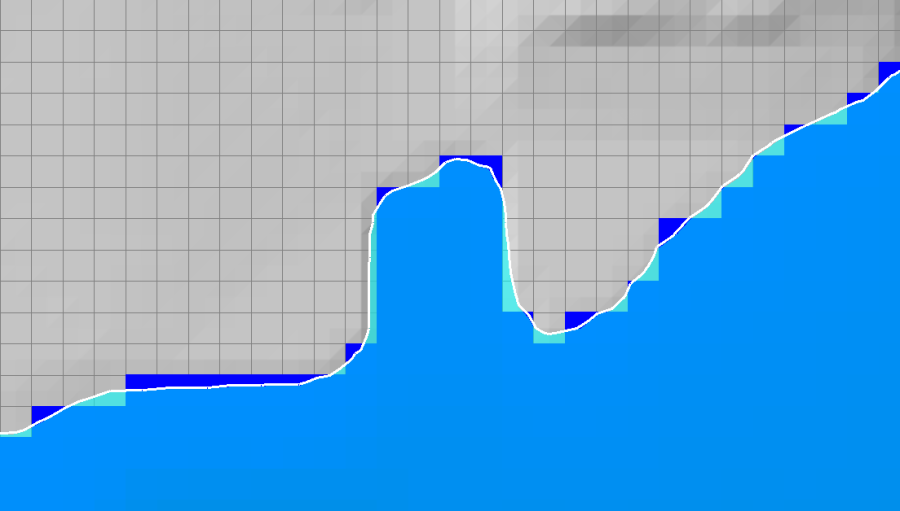
For dynamic depth results, the values reported to the user at a specific map location may change depending on the zoom level. This is because for dynamic mapping, the terrain pyramid level used for evaluating the ground surface elevation is dependent on how far the user has zoomed in or out on the map. Even while zoomed in so that the base data are used for analysis, the map results will not be identical, especially at the floodplain boundary. This is because for the stored depth grid the cell is considered either wet or dry. For a dynamic map, the flood boundary is determined by interpolating the elevations values and intersecting the interpolated water surface with the interpolated terrain elevations for the boundary. The dynamic map will, therefore, result in a "smooth" floodplain boundary. An example of the differences between the dynamic mapping and stored mapping are shown in Figure 64. 
.
2D Mapping Options
RAS Mapper has three Rendering Mode options for how the water surface is interpolated and displayed for 2D model results. The Render Mode options are to plot the water surface as either Hydrid (Sloping/Horizontal) (default); Sloping; or as Horizontal within a 2D cell. The render mode selection will affect both the dynamic map and the stored map results. To select the Render Mode, select Tools/Options to bring up the Options window, then select Render Mode, or select the render mode button ![]() on the button layer. Either way the RAS Mapper Options window will appear with the Render Mode settings display in the window.
on the button layer. Either way the RAS Mapper Options window will appear with the Render Mode settings display in the window.
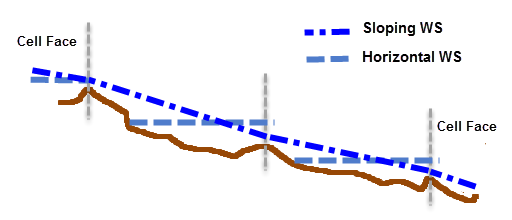
Hybrid (Sloping/Horizontal – Default) - This render mode is a combination of both the Sloping and the Horizontal render modes described below. In general the water surface is plotted using the sloping rendering mode, except for locations where the water surface is not hydraulically connected. For example, two cells that are wet, but have a Face between them that is dry. These two cells are not hydraulically connected, and therefore the sloping rendering model should not be used to plot the water surface across these two cells. Instead, the horizontal rendering mode is used for both cells.
Sloping Water Surface – The Sloping water surface rendering mode plots the computed water surface by interpolating water surface elevations from each 2D cell face. This option of connecting each cell face provides a visualization for a more continuous inundation map. The more continuous inundation map, looks more realistic; however, under some circumstances it can also have the appearance of more water or less water volume in the 2D cells than what was computed in the simulation. This problem generally occurs in steep terrain with large 2D grid cells. This sloping water surface approach is most helpful when displaying shallow inundation depths in areas of steep terrain. This is the default rendering mode. However, users should plot with both rendering modes and closely inspect the differences.
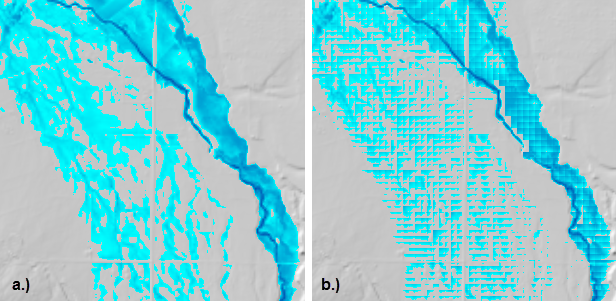
Horizontal Water Surface – The Horizontal water surface rendering mode plots the computed water surface as horizontal in each 2D Area cell. This option fills each 2D cell to the water surface as computed in the 2D simulation. In areas where the terrain has significant relief between 2D cells this plotting option can produce a "patchwork" of isolated inundated areas when visualizing flood depths. These isolated inundation areas are more visible in areas of steep terrain, using large grids cells, with shallow flood depths.
An illustration of the sloping and horizontal rendering modes is shown in Figure 65 while Figure 66 shows the spatial differences due to the rendering mode. 
